Figure 1: The map of van der Monde (1844-46) which stands at the basis of the map-regression of Utrecht.
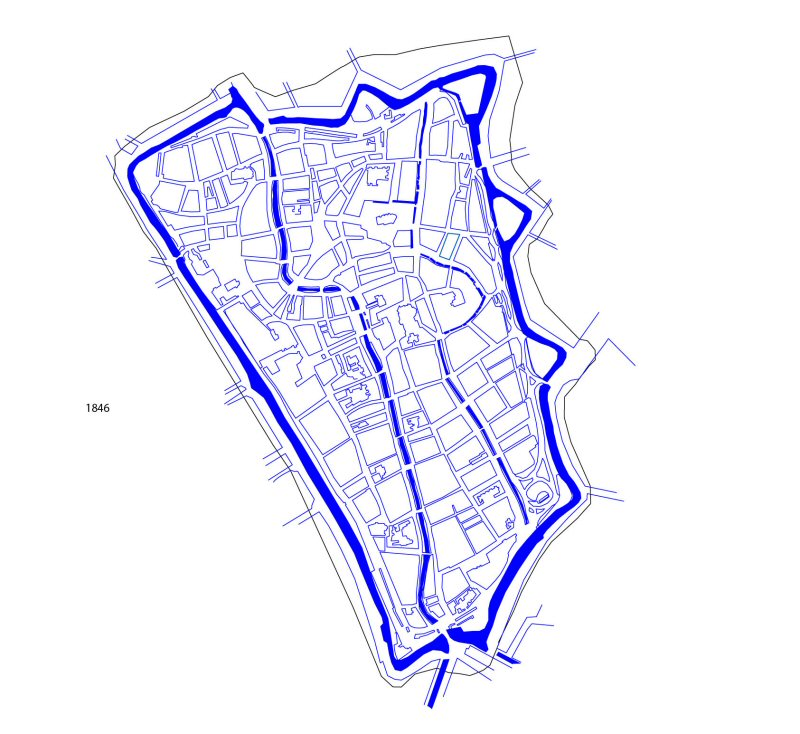
Figure 2: Plan of Utrecht in 1846, based on the map of van der Monde
Figure 3: Plan of Utrecht in AD 1000
Figure 4: Plan of Utrecht in AD 1150
Figure 5: Plan of Utrecht in AD 1200
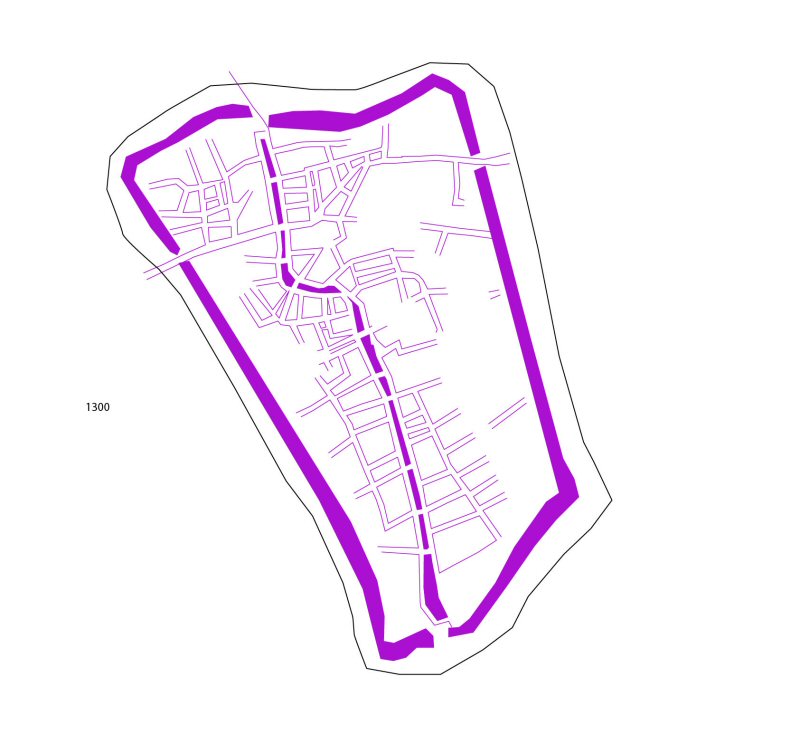
Figure 6: Plan of Utrecht in AD 1300
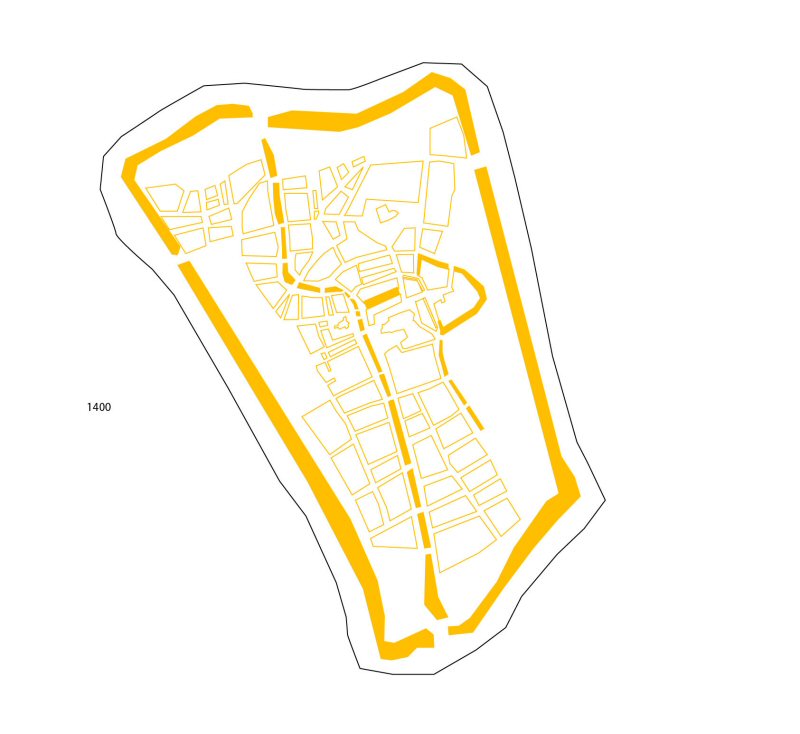
Figure 7: Plan of Utrecht in AD 1400
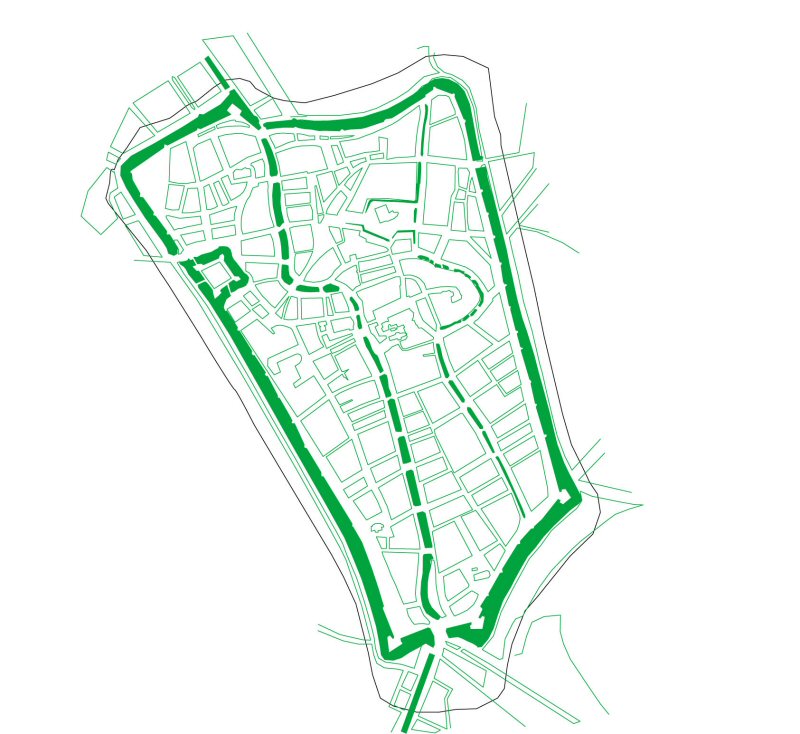
Figure 8: Plan of Utrecht in AD 1550
Figure 9: Plan of Utrecht in AD 1846
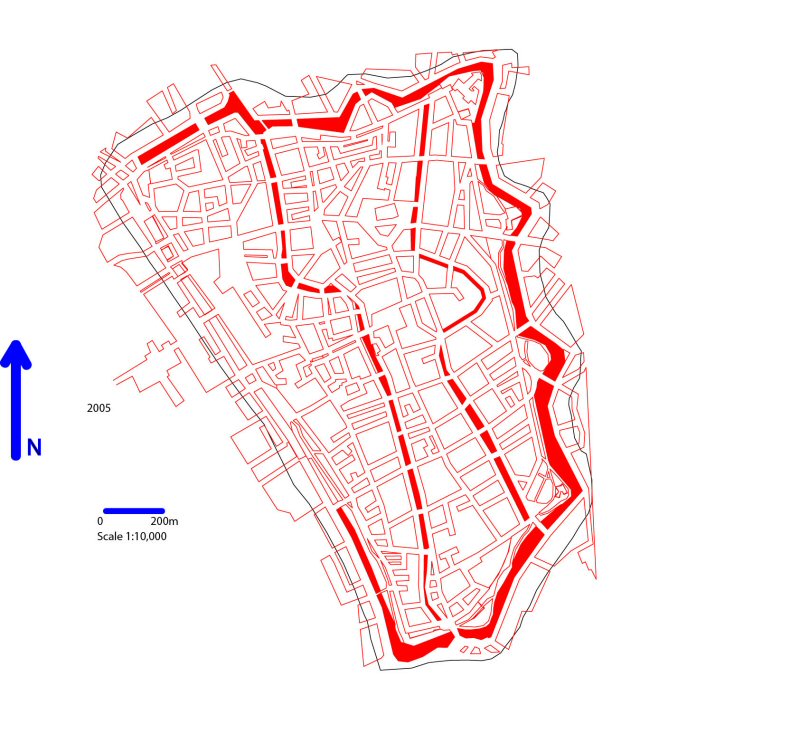
Figure 10: Plan of Utrecht in AD 2005
Figure 11: Axial all line map section
Figure 12: Axial fewest line map section
Figure 13: ASA map section
Figure 14: Location of Utrecht in the centre of The Netherlands
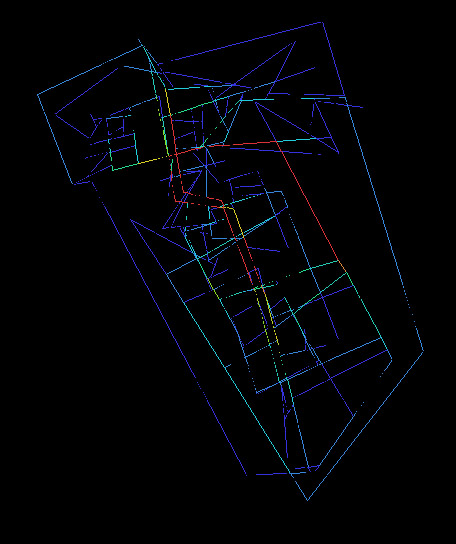
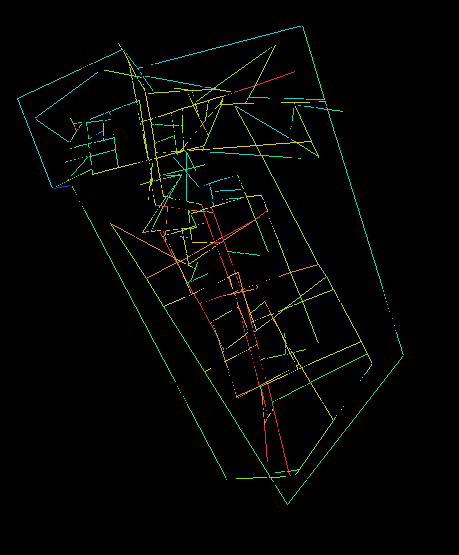
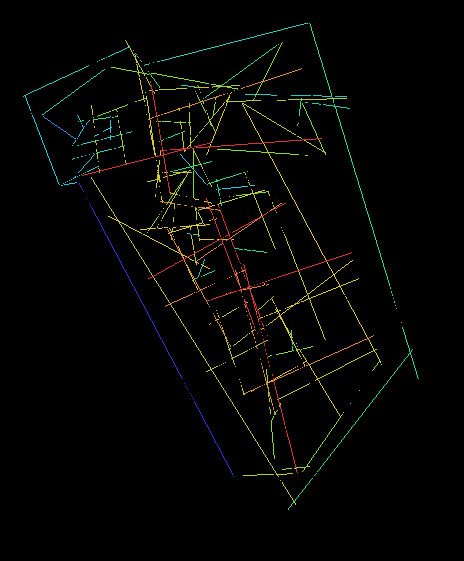
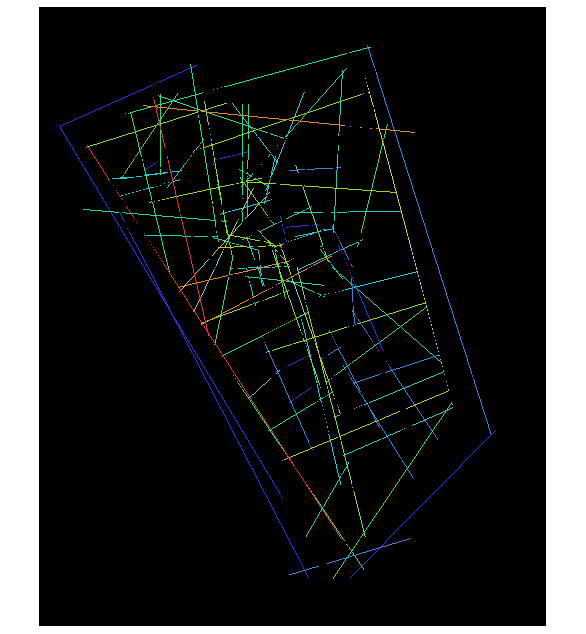
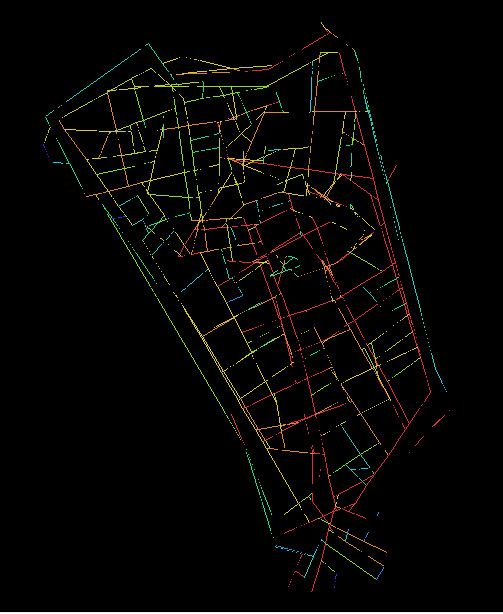
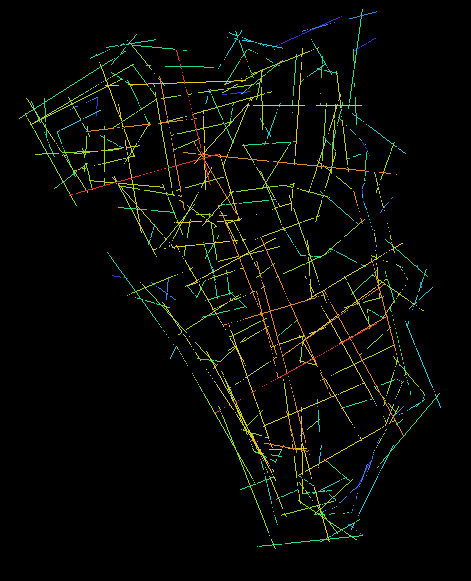
Figure 15: Analysis of Utrecht in 1300: Asa Global Choice (red + 2)
Figure 16: Analysis of Utrecht in 1300: Asa Global Mean Depth
Figure 17: Analysis of Utrecht in 1300: Asa Local Choice (red + 2)
Figure 18: Analysis of Utrecht in 1300: Asa Local Mean Depth
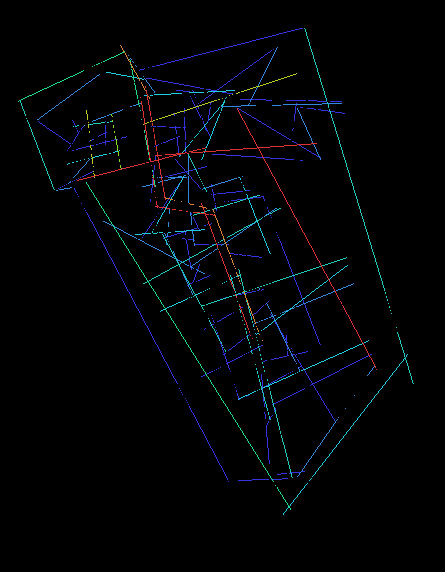
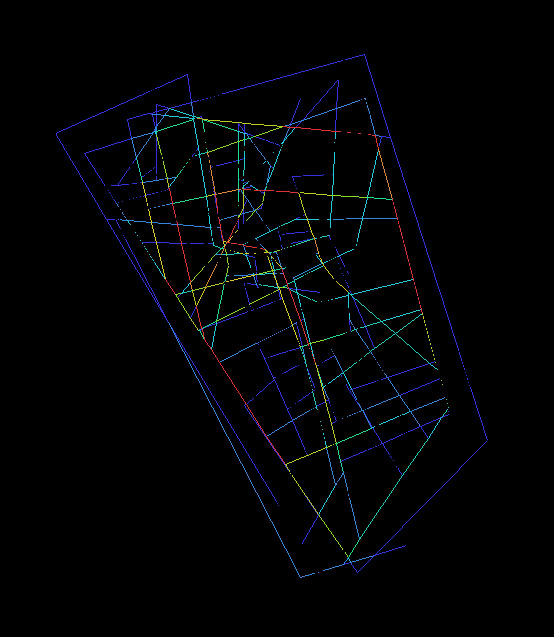
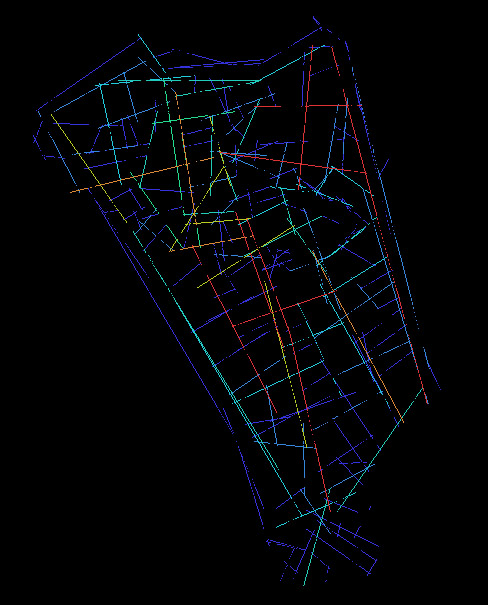
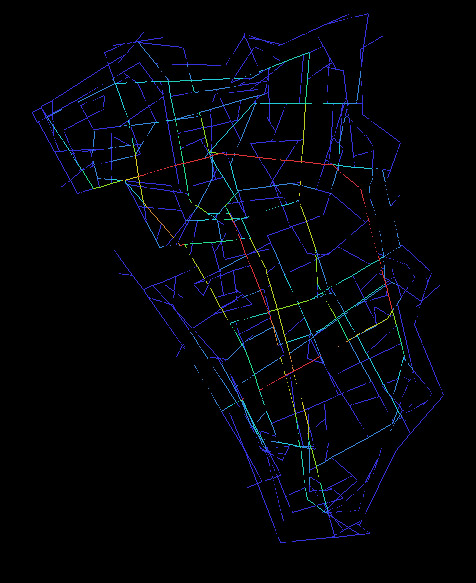
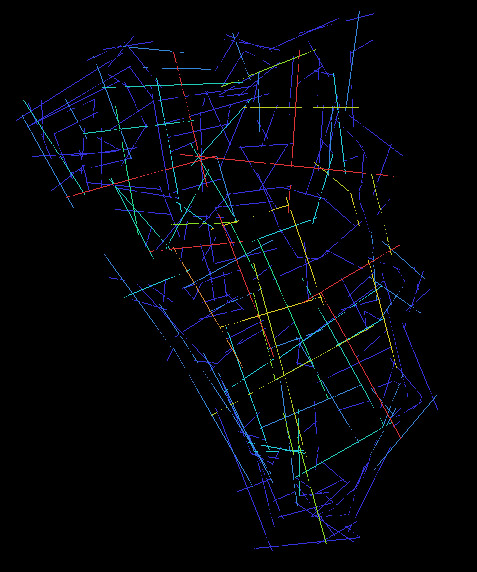
Figure 19: Analysis of Utrecht in 1300: Axial Global Choice (red + 2)
Figure 20: Analysis of Utrecht in 1300: Axial Global Integration
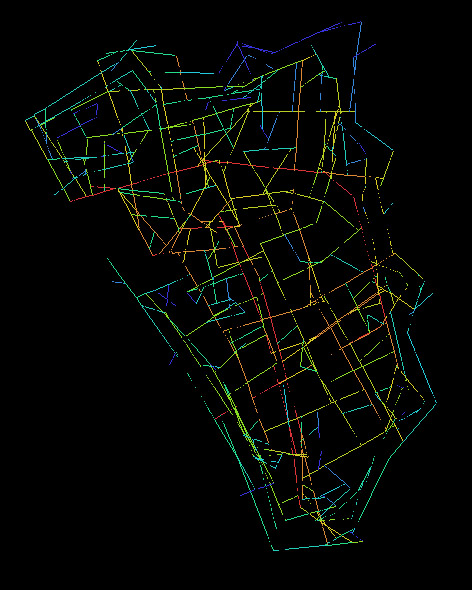
Figure 21: Analysis of Utrecht in 1300: Axial Local Choice (red + 2)
Figure 22: Analysis of Utrecht in 1300: Axial Local Integration
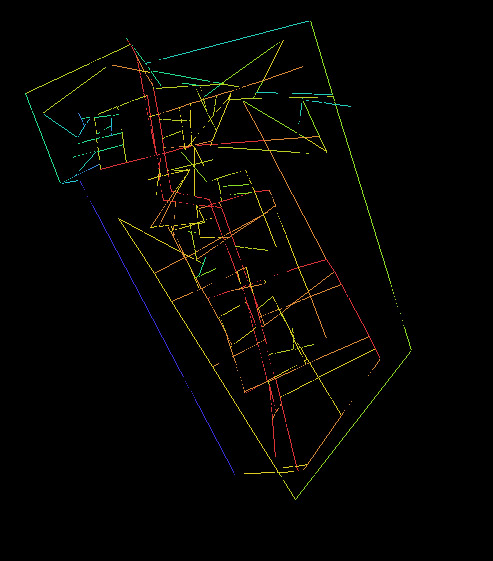
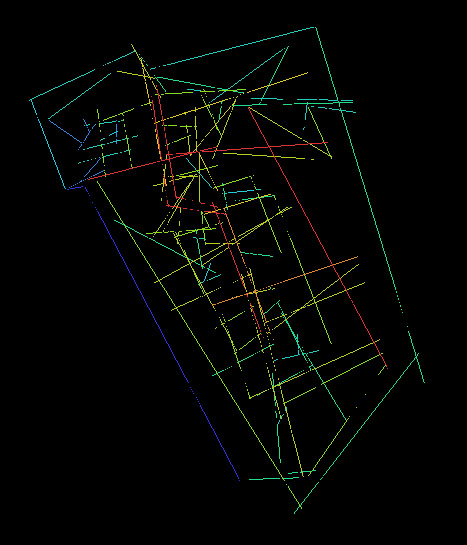
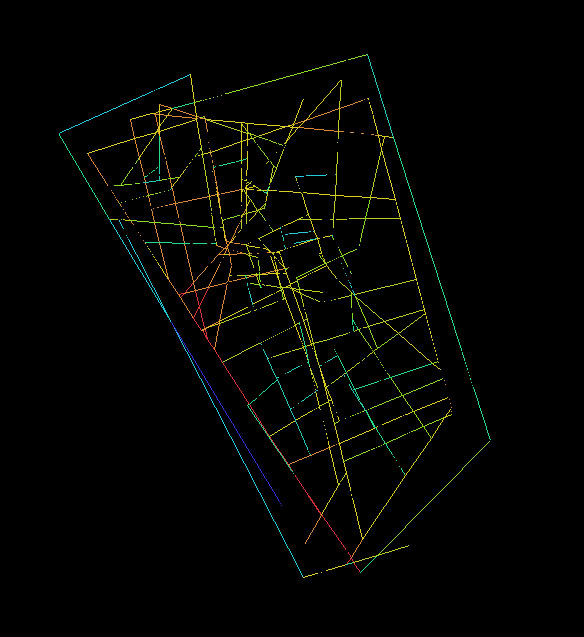
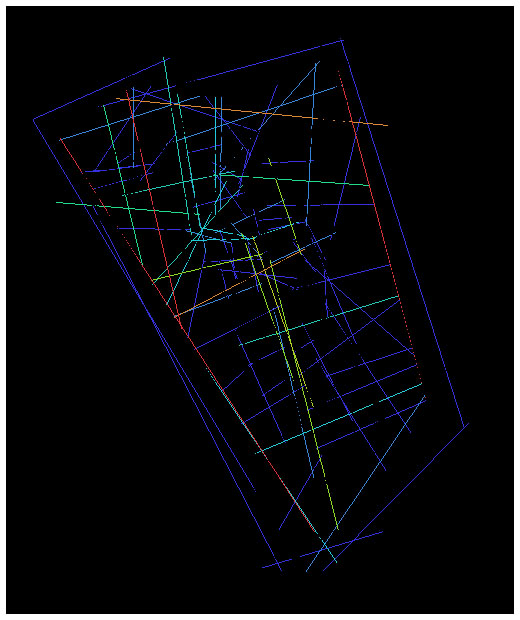
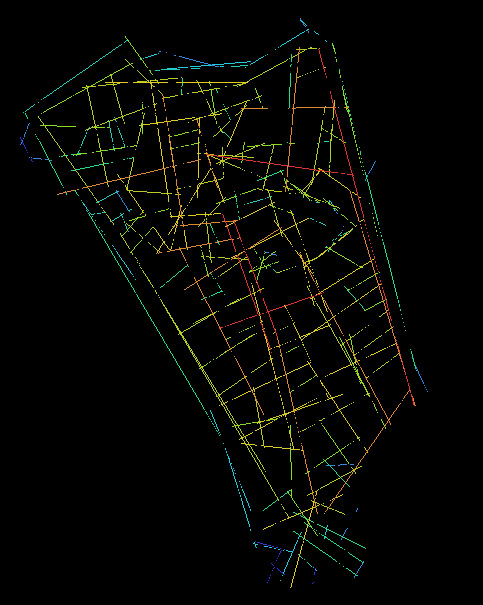
Figure 23: Analysis of Utrecht in 1400: Asa Global Choice (red + 2)
Figure 24: Analysis of Utrecht in 1400: Asa Global Mean Depth
Figure 25: Analysis of Utrecht in 1400: Asa Local Choice (red + 1)
Figure 26: Analysis of Utrecht in 1400: Asa Local Mean Depth (red + 1)
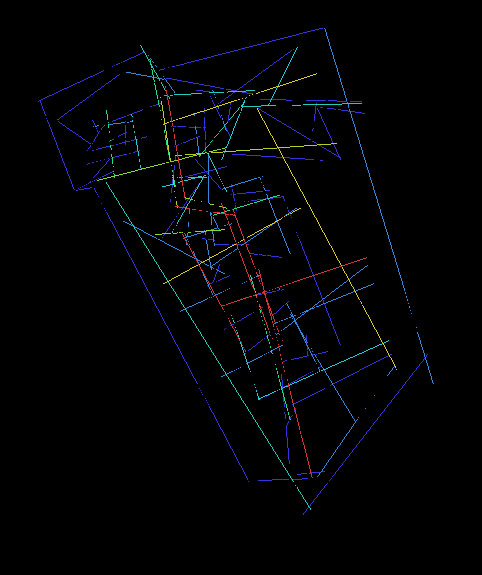
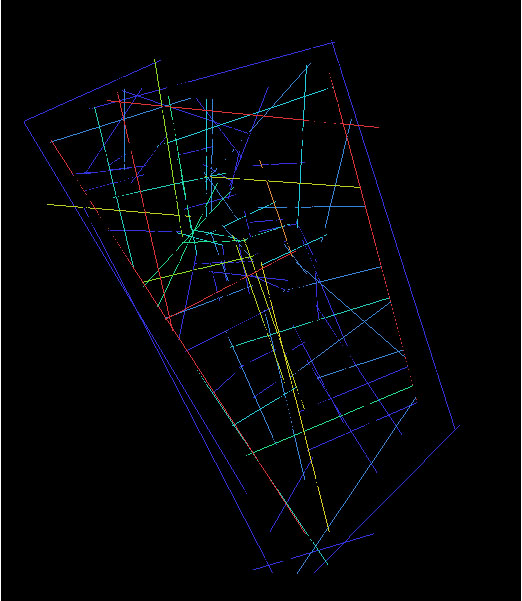
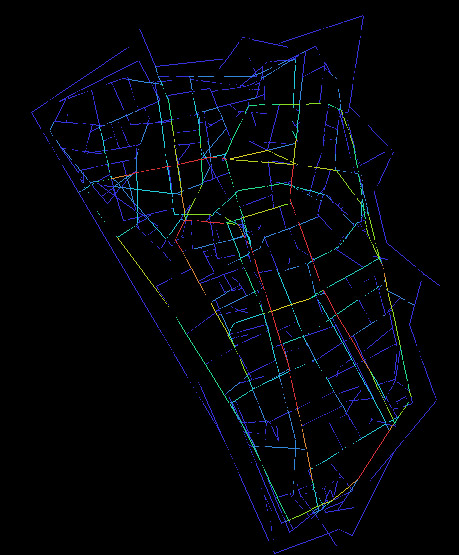
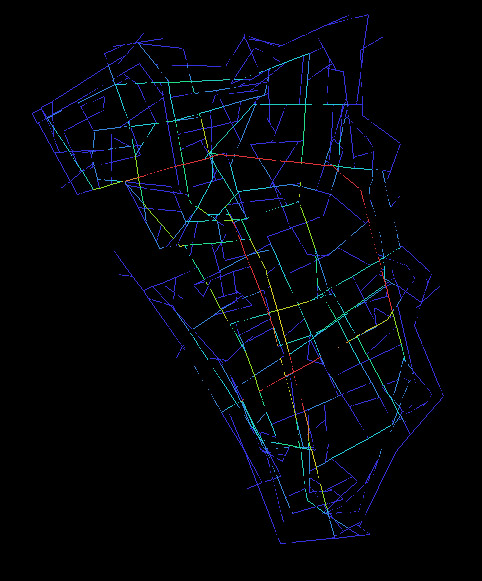
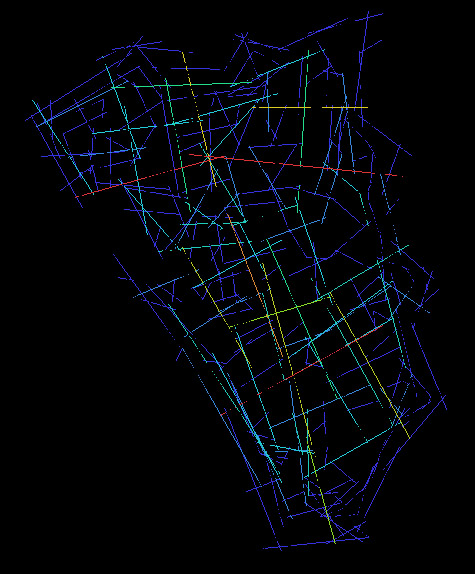
Figure 27: Analysis of Utrecht in 1400: Axial Global Choice (red + 2)
Figure 28: Analysis of Utrecht in 1400: Axial Global Integration
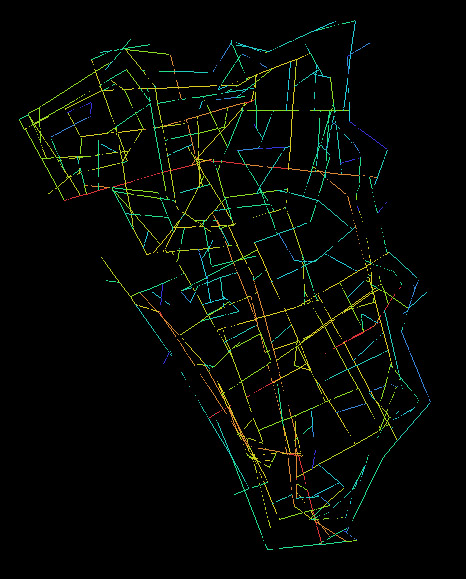
Figure 29: Analysis of Utrecht in 1400: Axial Local Choice (red + 1)
Figure 30: Analysis of Utrecht in 1400: Axial Local Integration
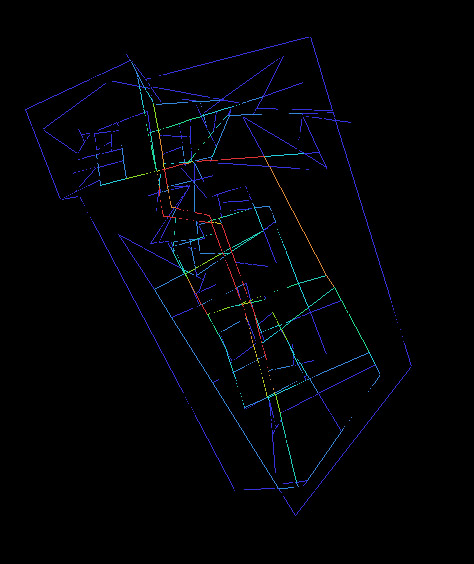
Figure 31: Analysis of Utrecht in 1550: Asa Global Choice (red + 2)
Figure 32: Analysis of Utrecht in 1550: Asa Global Mean Depth (red + 2)
Figure 33: Analysis of Utrecht in 1550: Asa Local Choice (red + 2)
Figure 34: Analysis of Utrecht in 1550: Asa Local Mean Depth (red + 4)
Figure 35: Analysis of Utrecht in 1550: Axial Global Choice (red + 2)
Figure 36: Analysis of Utrecht in 1550: Axial Global Integration
Figure 37: Analysis of Utrecht in 1550: Axial Local Choice (red + 2)
Figure 38: Analysis of Utrecht in 1550: Axial Local Integration
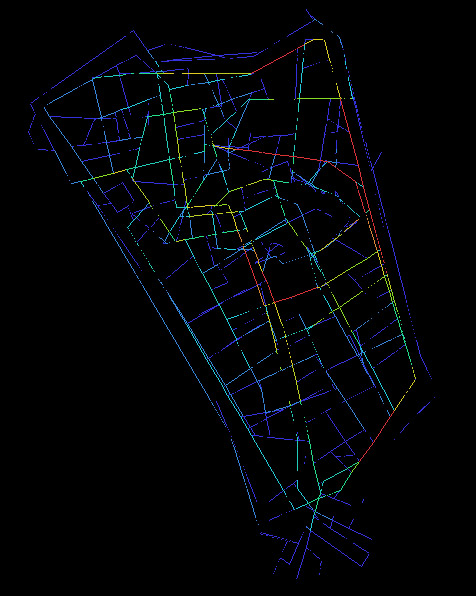
Figure 39: Analysis of Utrecht in 1846: Asa Global Choice (red + 2)
Figure 40: Analysis of Utrecht in 1846: Asa Global Mean Depth (red + 2) blue plus 1
Figure 41: Analysis of Utrecht in 1846: Asa Local Choice (red + 2)
Figure 42: Analysis of Utrecht in 1846: Asa Local Mean Depth (red + 4)
Figure 43: Analysis of Utrecht in 1846: Axial Global Choice (red + 2)
Figure 44: Analysis of Utrecht in 1846: Axial Global Integration (red + 1)
Figure 45: Analysis of Utrecht in 1846: Axial Local Choice (red + 2)
Figure 46: Analysis of Utrecht in 1846: Axial Local Integration (red + 1)
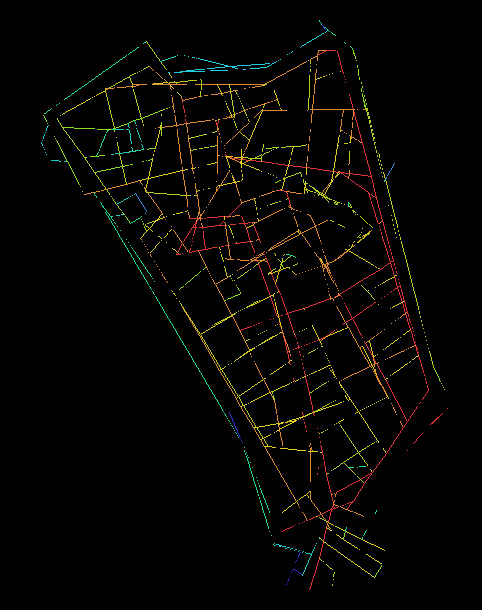
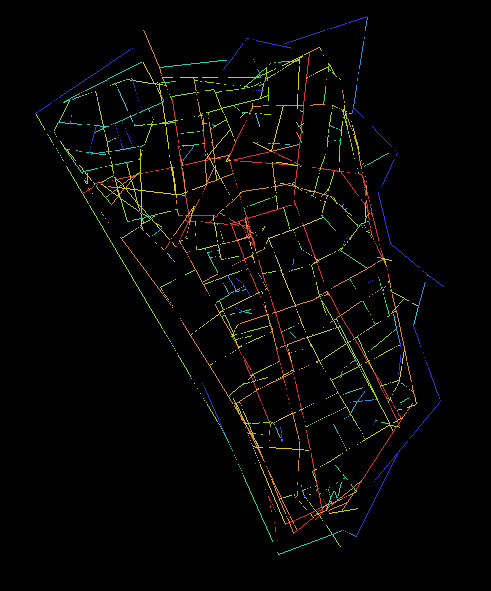
Figure 47: Analysis of Utrecht in 2005. Asa Global Choice (red + 2)
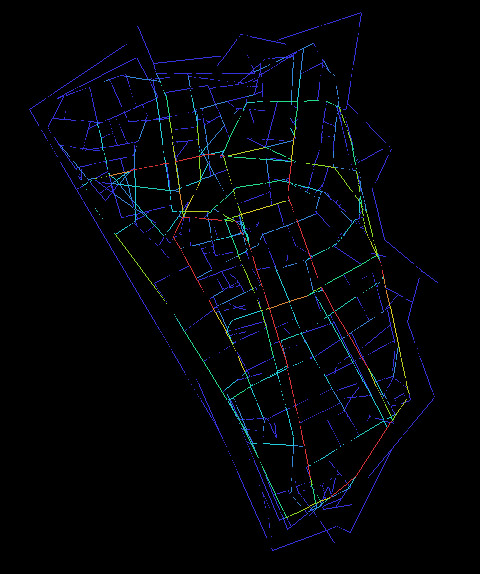
Figure 48: Analysis of Utrecht in 2005. Asa Global Mean Depth (blue + 2)
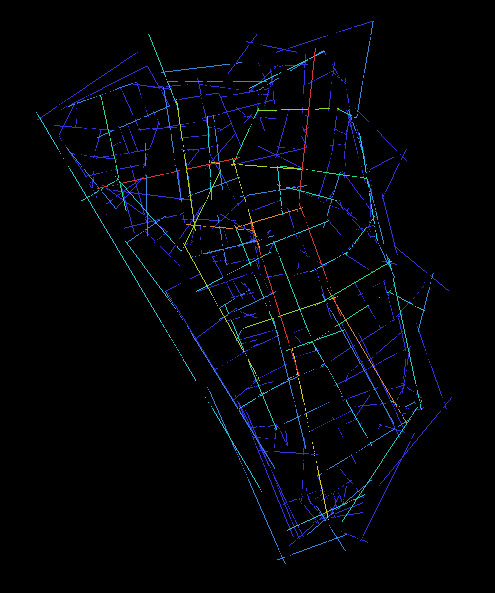
Figure 49: Analysis of Utrecht in 2005. Asa Local Choice (red + 2)
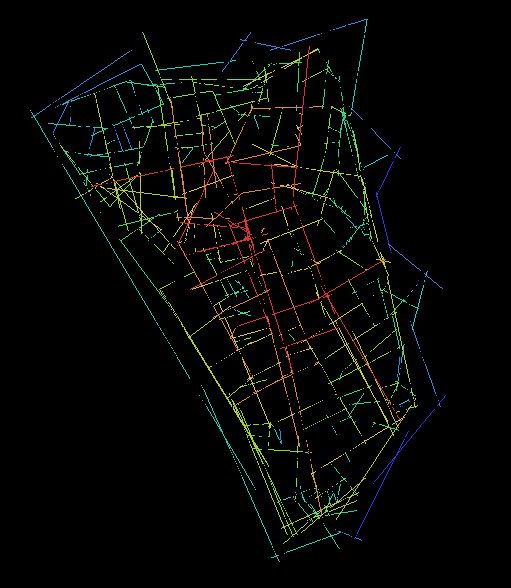
Figure 50: Analysis of Utrecht in 2005. Asa Local Mean Depth
Figure 51: Analysis of Utrecht in 2005. Axial Global Choice (red + 2)
Figure 52: Analysis of Utrecht in 2005. Axial Global Integration (red + 1)
Figure 53: Analysis of Utrecht in 2005. Axial Local Choice (red + 2)
Figure 54: Analysis of Utrecht in 2005. Axial Local Integration
Figure 55: Location of Utrecht's economic spaces in AD 1200
Figure 56: Location of Utrecht's economic spaces in AD 1400
© Internet Archaeology / Author
URL: http://intarch.ac.uk/journal/issue21/5/tof.html
Last updated: Wed Aug 8 2007