Cite this as: van Helden, D., Hong, Y and Allison,P. 2018 Building an Ontology of Tablewares using 'Legacy Data', Internet Archaeology 50. https://doi.org/10.11141/ia.50.13
This article discusses how an ontology has been constructed, using 'legacy data', to carry out consumption-orientated analyses of Roman tablewares. The resulting ontology, or a version of it, is intended to be useable, adopted and adapted, for the collation and analyses of Roman tablewares within and between sites. The ontology model can be further developed for collating other kinds of archaeological data. Ontologies are very flexible tools. 'Legacy data', as defined in the Information Sciences, comprise data and information that are not 'digitally born', or are stored in old or obsolete formats or computer systems and are therefore difficult to access or process.
The 'legacy data' used here comprise the catalogues of artefacts recorded from the excavations of the auxiliary fort at Ellingen, originally published in print (Zanier 1992) and then digitally collated into an Excel spreadsheet and relational databases for the Engendering Roman Military Spaces project (Allison et al. 2005; Allison 2012; 2013, 232-36, 421-36). This means we are using information that is not originally in an ideal form, or necessarily comprehensive, for either the specific aims of this article or the broader aims of this network. However, given the plethora of such datasets across Roman archaeology we cannot simply ignore them. To provide the data and the structure from which to build a suitable ontology for the aims of the 'Big Data on the Roman Table' network, I selected specific data from the Excel spreadsheet that comprised potential tablewares, almost exclusively ceramics, and associated provenance information. My first task was to organise much of the still fairly descriptive information in these spreadsheets into appropriate and comprehensible fields that would provide the bases for many of the classes, properties and individuals (or 'instances') needed for an ontology (see Data file). For example, because the fields in the original spreadsheet cover all the different types of artefacts recorded from the fort at Ellingen and were compiled for the aims of the Engendering Roman Military Spaces project, much of the information about the fabric types, decoration, centres of production, and makers of these tablewares were included in a single field. Further fields were therefore added to the spreadsheet to separate out this information for this project.
This article picks up from this point, after these spreadsheet data were appropriately collated. It commences with an outline, by Yi Hong, of the advantages of an ontology format over more standard databases. The core of the article comprises a discussion on the processes used and the decisions made by Daniël van Helden, an archaeology PhD student and non-IT specialist, to create an ontology from these spreadsheet data. Hong then provides instructions on how to input these 'legacy data' into the ontology created by van Helden. Finally, Allison and van Helden carry out some sample analyses to demonstrate how this ontology can be used for consumption-orientated approaches to Roman tablewares and discuss this ontology's appropriateness for inter-site analyses. We would like to state, up front, that none of the authors are Roman pottery specialists so there may be taxonomic irregularities embedded in the current structure of our ontology, but this is not an insurmountable problem given the flexibility of the tool.
Traditionally, archaeological data are stored in Relational Databases (RDB). Relational database management systems (RDBMS) such as Microsoft Access, SQL server, MySQL, Oracle, and Filemaker, as well as simple flat-file databases such as Microsoft Excel, are widely used for this. RDBs have three basic concepts: tables, fields (columns) and records (rows). The logical and physical definition of a relational database structure is based on its schema. A database schema specifies the columns in tables and links among them. A table organises the information about a specific item into rows and columns. Each table has one (or more than one) column as the primary key, which uniquely identifies a record. Tables are linked through primary-foreign key pairs. RDB and spreadsheets are easy to use and are ideal choices for simple item-based data storage but there are many limitations.
The re-usability of the database schema is always problematic in Relational Databases (RDBs). To take an example from the archaeological research project 'The Tracing Networks Programme' (see Foxhall et al. 2012), suppose a table for recording production centres already exists. If we want to describe more specific types of production centres, such as a ceramic production centre or a glass production centre that might have some additional attributes, one possible solution in an RDB is either to add further columns for all existing rows, as Allison did for the Ellingen Excel spreadsheet, or to duplicate the table. RDBs do not natively support inheritance, from a higher level or from another RDB dataset or RDB format. For this reason, it is difficult to share or reuse fragments of schema or vocabulary with others (i.e. between sites or excavation projects) as many existing databases were created and maintained internally within the organisation or project.
RDBs require that schemas be defined before users can add data. Fixed schemas are not suitable for representing every form of information and there is no standard way to reuse or extend schemas in RDBs. For example, a table might contain 'Fabric type 1', 'Fabric type 2' … 'Fabric type n'. If we want the table to be able to record all possible fabric types and their sub-types, one possible spreadsheet solution is to add multiple columns for all levels of fabric types and sub-types, despite the fact that these fields are not always necessary for each artefact. Alternatively, a separate junction table could be created to record each fabric type in respect of each artefact. However, the latter solution requires changes to the database schema and such changes, after the application becomes operational, might have unintended impacts on the entire system. To ensure data integrity and system stability, RDB developers are usually reluctant to change the schema.
Spreadsheets and flat-file databases might be a first choice for describing a specific type of artefact with simple text and numeric attributes. But RDBs have their disadvantages when it comes to linking various artefacts and their archaeological context, which can have complex data structures. In RDBs, the links between tables are implicitly defined by so-called primary-foreign key pairs. They do not give a clear indication of the relationships between tables. Therefore, it is often a challenge for non-IT professionals, such as archaeologists, to design an effective database structure for complex data and relations, or, conversely, for IT specialists to design an effective structure for the needs of archaeologists.
RDBMSs use SQL (Structured Query Language) for searching databases. Owing to the complexity of the language, non-IT professionals usually find it difficult to write a syntactically correct SQL statement. Queries are usually built by a GUI (Graphical User Interface), a front-end form for query building consisting of various text boxes and filters. Users can enter keywords and choose filters to narrow down the search results. However, a form-based approach offers very limited expressiveness. For example, queries about relationships are currently not supported (e.g. to show possible links between two artefacts). Traditional parameterised search interfaces essentially restrict the types of questions a user can ask. In theory, a dynamically generated form would be more expressive, but it makes the query building process tedious and user-unfriendly. Currently there is no standard way to incorporate automated reasoning into the search engine. The system is not able to use background knowledge for reasoning.
The term 'ontology' is a compound word from ancient Greek. It is composed of onto (being or the nature of things) and logia (theory). It was used in the study of the nature of existence in classical philosophy. In computer science, an ontology is a formal specification of a conceptualisation. In an ontological world, knowledge is modelled by concepts, which are specified by the ontology. In other words, ontologies describe the domain of the real world (see Gruber 1995). In contrast to RDBs with tables, fields and records, the main concepts in an ontology-based database are classes, properties and individuals. The definition of a particular class can be described using Description Logic (DL), which is a formal knowledge representation language. Properties are attributes of a class or relations between classes. Individuals are instances of the classes. Individuals and instances are more or less synonymous. The only difference is that, when using the term 'instance', we normally also mention its class. For example, we can say 'a' is an instance (of class A) or we can say 'a' is an individual (without mentioning its class). There is a tendency to use 'instance' because 'individual' is sometimes wrongly interpreted as 'a person (instance of class Human)' by people unfamiliar with the terminology (Kusnierczyk 2006). In an RDB the basic units are records (rows); each row in a table represents a set of data, which are identified by primary keys. In an Ontology-based Database (OntDB), RDF (Resource Description Framework) triples are used to define statements. An RDF triple consists of three parts: a subject, a predicate, and an object. A set of RDF triples becomes a graph, so technically an ontology-based database is a graph. OWL (Ontology Web Language) is one of the most popular ontology languages built on top of an RDF. Section 3 aims to provide a sense of how these more formal statements work in practice. Ontologies offer many benefits over traditional relational modelling approaches to address some issues discussed earlier (see also Martinez-Cruz et al. 2012).
An ontology is a more flexible and schema-less data model. Classes and properties can be reused in an ontology by means of inheritance. All properties and relations defined for a superclass (i.e. next higher level of class) can be inherited by all its subclasses. Through this, one can extend classes or properties that are already defined in the same ontology (or somewhere else). For example, if 'inventory number' is defined as an attribute for a generic class 'Artefact', then all its subclasses (e.g. pot) will automatically inherit this attribute.
Ontologies are more expressive in describing statements by using RDF triples (subject-predicate-object).
Logical links and constraints are represented explicitly. Compared with RDBs, users are able to write more complex queries, with the help of a Visual Query Interface that was developed in 'The Tracing Networks Programme', which can be used to search ontology-based database be means of graph patterns.
In ontologies, built-in aggregate functions can be applied to selected data to produce a variety of statistical charts and diagrams. The resulting format is also compatible with Excel.
Ontologies derive new context data via various rule-based and Description Logic reasoners. Ontology languages such as OWL support various property characteristics (e.g. transitive, symmetric, functional, inversed relations). More information on inferencing can be found at W3C OWL Specification https://www.w3.org/TR/owl-ref/#PropertyLogic
Ontologies can incorporate and reuse vocabularies from other existing ontologies. Standard upper domain ontologies are available for use, such as CIDOC-CRM (Conceptual Reference Model) which is an ISO standard ontology (International Organisation for Standardization) in the cultural and heritage domain (see also Stellar Project).
This section describes the building process and the structure of the ontological data model I have developed for collating Roman tablewares for consumption-orientated analyses using Protégé and OWL. Protégé is a free, open source and cross-platform ontology editor for OWL (The Web Ontology Language) developed by Stanford University. At the same time I discuss the structural decisions that were made in response to problems encountered during the building process. Many of the distinguishing features of ontologies can perhaps best be illuminated for archaeologists by asking an archaeologist, with little ontology-related experience, to build an ontological data model and describe the process. That said, this data model has been built with Hong's support, which has considerably speeded up my own acquisition of ontology skills and knowledge of ontologies' functionality, and the possibilities of ontology building software (see Hong et al. 2010). Furthermore, answers to my questions regarding Roman pottery classification from Marenne Zandstra (Roman finds specialist, Radboud University, Nijmegen) have saved me from making a number of errors in this regard. Any remaining ones are my own or were in the original data.
We designed this tool so that it might be widely useable, for a range of sites and questions. It is obviously difficult, and seemingly foolhardy, to expect to be able to pre-empt the sorts of questions other interested scholars might want answered through this data model, but the flexibility of ontologies is a major benefit here. Indeed, much of the remodelling that was needed to refine our ontology, as we considered new questions in our sample analyses, was quite easy to carry out. This means that future structural changes to the ontology to address future questions or to draw in data stored in other databases will also be relatively easy to implement.
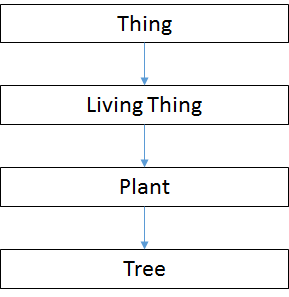
As outlined by Hong, ontologies use a hierarchy of classes to order concepts. The relation between a subclass and a superclass is always an 'is a' relation. For example, a tree is an instance (the lowest rung of the hierarchy) of a plant, which is a living thing, which is a thing, which is the highest class in the hierarchy (see Figure 1).
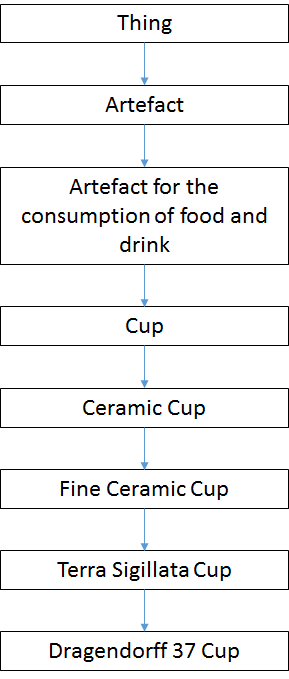
With regard to pottery a possible hierarchy would then be: a Drag. 37 is a terra sigillata cup, which is a fine ceramic cup, which is a ceramic cup, which is a cup, which is reportedly an artefact for the consumption of food and drink, which is an artefact, which is a thing (see Figure 2).
From the point of view of the ontology this is completely valid. It is not even very wrong; it contains no known lies (although see the discussion on 'Form_Label' below). In the final model, however, almost all the information contained in the above hierarchy has been reconfigured and integrated into a class hierarchy as five different classes on levels below 'Thing', namely: 'Artefact', 'Form_Label', 'Form_Type', 'Function' and 'Material' (see Figure 3, vertical lines indicate superclass-subclass relations between two classes, dashed lines indicate that a further class hierarchy exists below these classes).
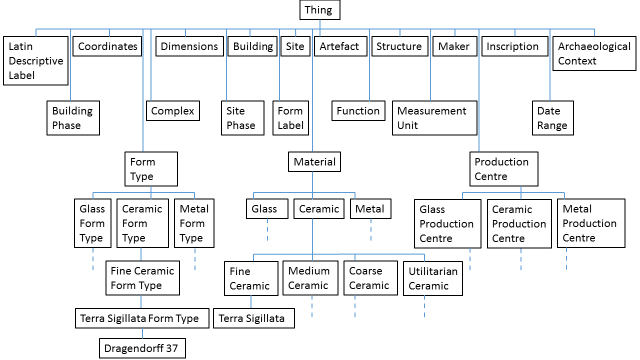
This makes it easier to link the information in the ontology and to retrieve it. So, the levels 'Dragendorff 37' and 'Terra Sigillata' are now instances of the 'Form_Type' and 'Material' class, respectively. 'Ceramic' and 'Fine Ceramic' are subclasses under 'Material'. 'Cup' would now be an instance of the class 'Form_Label', while 'Artefact for the consumption of food and drink' would be an instance of the class 'Function'. In the final model, 'Form_Label' (e.g. cup) was separated from the chain of Figure 2 and given the name 'Form Label', since 'cup' is actually an interpretative category, which imparts a purported, but frequently unsubstantiated, function on the object (see Bermejo Tirado this volume; Christmas and Pitts, this volume). These 'Form_Label' terms (i.e. cups, plates etc.) are used conventionally by modern scholars, but this means that by using them to describe ancient ceramic forms we implicitly colour our interpretations of their past use. For example, it is by no means certain that many so-called 'cups' did not have other uses, unrelated to drinking (see Dannell 2006; Allison 2017, 190-92; see also Dannell, this volume). Such functional interpretations, which were in the original publication, have been retained in the final model so that it includes many of the criteria used to describe Roman tablewares. They could be used in comparative analyses, but are not essential to the structure of the data model. As such, they can be subjected to critical analysis and could be rejected without consequences for the integrity of the model.
Some of the conceptual differences between relational databases and ontological data models can cause confusion. The data entered into a relational database are based on statements of the following nature: 'Record, Attribute, Value'. This means that 'Rose, Colour, Red' would mean that this rose has the value 'Red' for the attribute 'Colour'. This is what is stored as the information. The ontology way is with triple statements of the nature 'Subject, Predicate, Object'. The same information would then be described as 'Rose, has_Colour, Red'. The triple statement appears to introduce more unfamiliar terminology. It is useful to keep the following distinctions in mind, as also articulated by Hong. An ontological data model is based on classes, which are arranged in a class hierarchy (see Figure 1, Figure 2, Figure 3). Relations between classes are expressed as properties (the arrows in Figure 4 and Figure 5). However, data are entered as triple statements, in which the role of subject and object are filled by instances of classes, whereas the properties fill the role of the predicate.

All this does not seem wildly different from the traditional way of thinking about databases, which caused some problems for me as I approached this building process with an RDB mind-set. The main difference is that all three parts of an expression of 'Record, Attribute, Value' have different statuses. The only 'real things' are the records. These are the things that get fed into the database as entities, with the other aspects providing information about them. However, in an ontology, subjects and objects of statements are not necessarily of different statuses. They are for the purposes of the current triple statement, but not in the context of the model as a whole. This means that concepts that had different statuses in relational databases can operate on the same level in triple statements. Figures 6 and 7 serve to illustrate this difference in status.
That is, Figures 6 and 7 provide details of class hierarchies, with the yellow circles indicating classes and purple diamonds indicating instances of the selected class – i.e. Dragendorff forms and catalogue numbers for actual sherds.
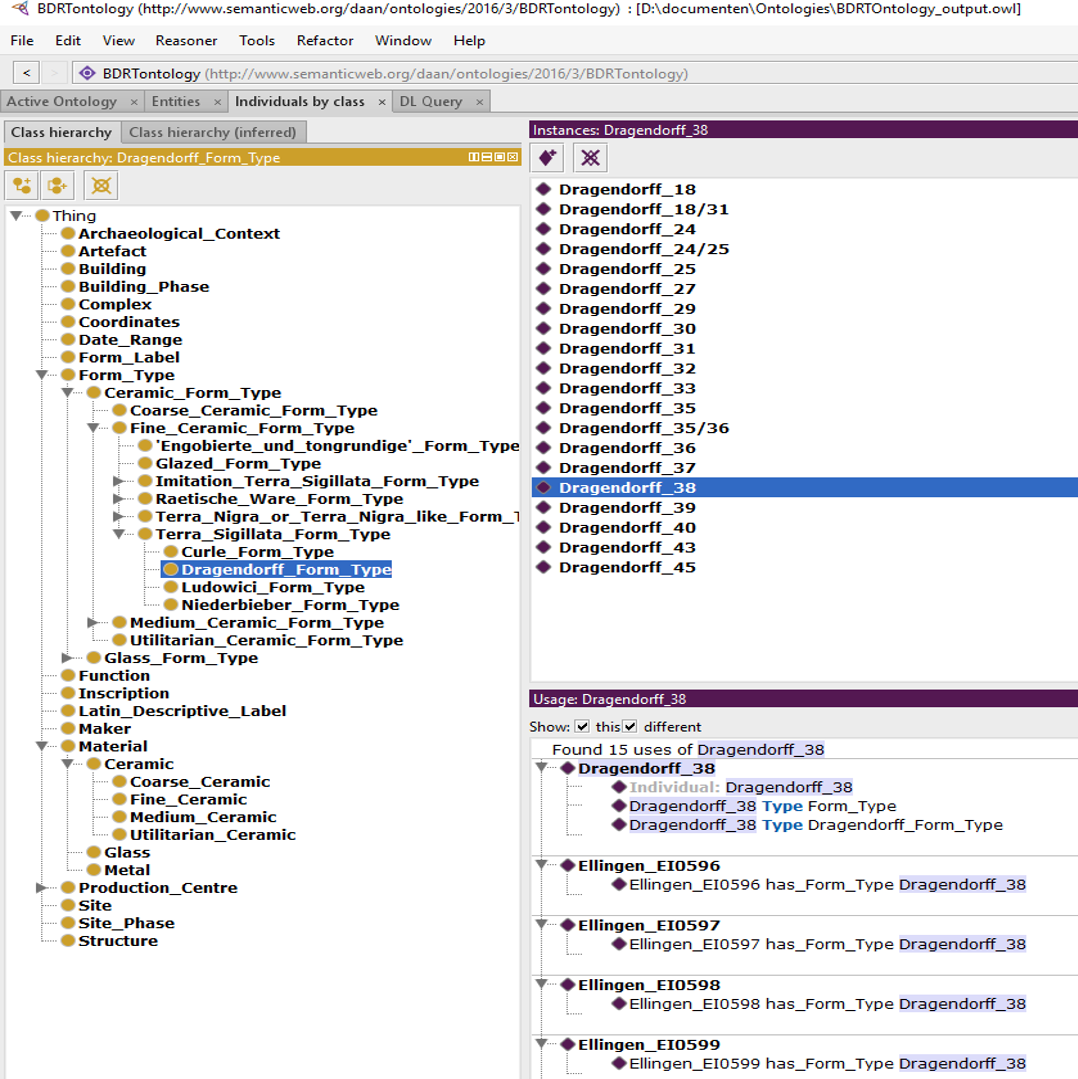
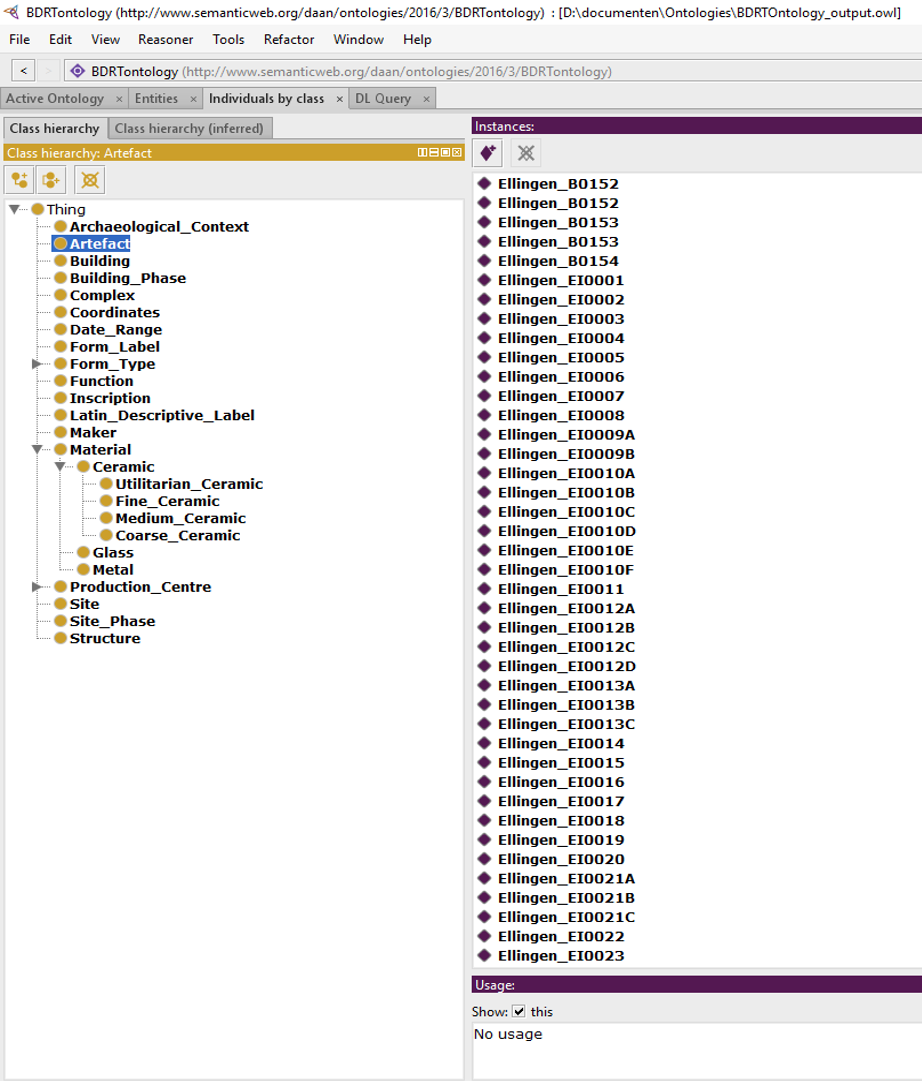
My original difficulty was that I saw classes as labels (similar to attributes in an RDB) and instances as individuals (or records) to which these labels were applied. I had no problems understanding that individual artefacts could be instances, but it took me a while to realise that 'Dragendorff 37' should be an instance in the same regard. I became aware of this problem because one can only assert triple statements with instances as subject and object. Ultimately, I realised that, in RDF language, 'instance' does not denote a special status, but rather that they are the bottom rung of the hierarchy. In this regard, 'Ellingen_B0152' (i.e. catalogue. no. B0152 at Ellingen) and 'Drag. 37' are no different. They are both instances of their respective classes.
The actual process of creating the data model involved a lot of staring at the Excel spreadsheet compiled and manipulated by Allison to facilitate conversion of the data into an ontology. I spent a lot of time looking at and thinking about the data before I could come up with logical hierarchies and networks of relationships. Using pencil and paper, I first sketched these out, then discarded them, and then sketched them out again.
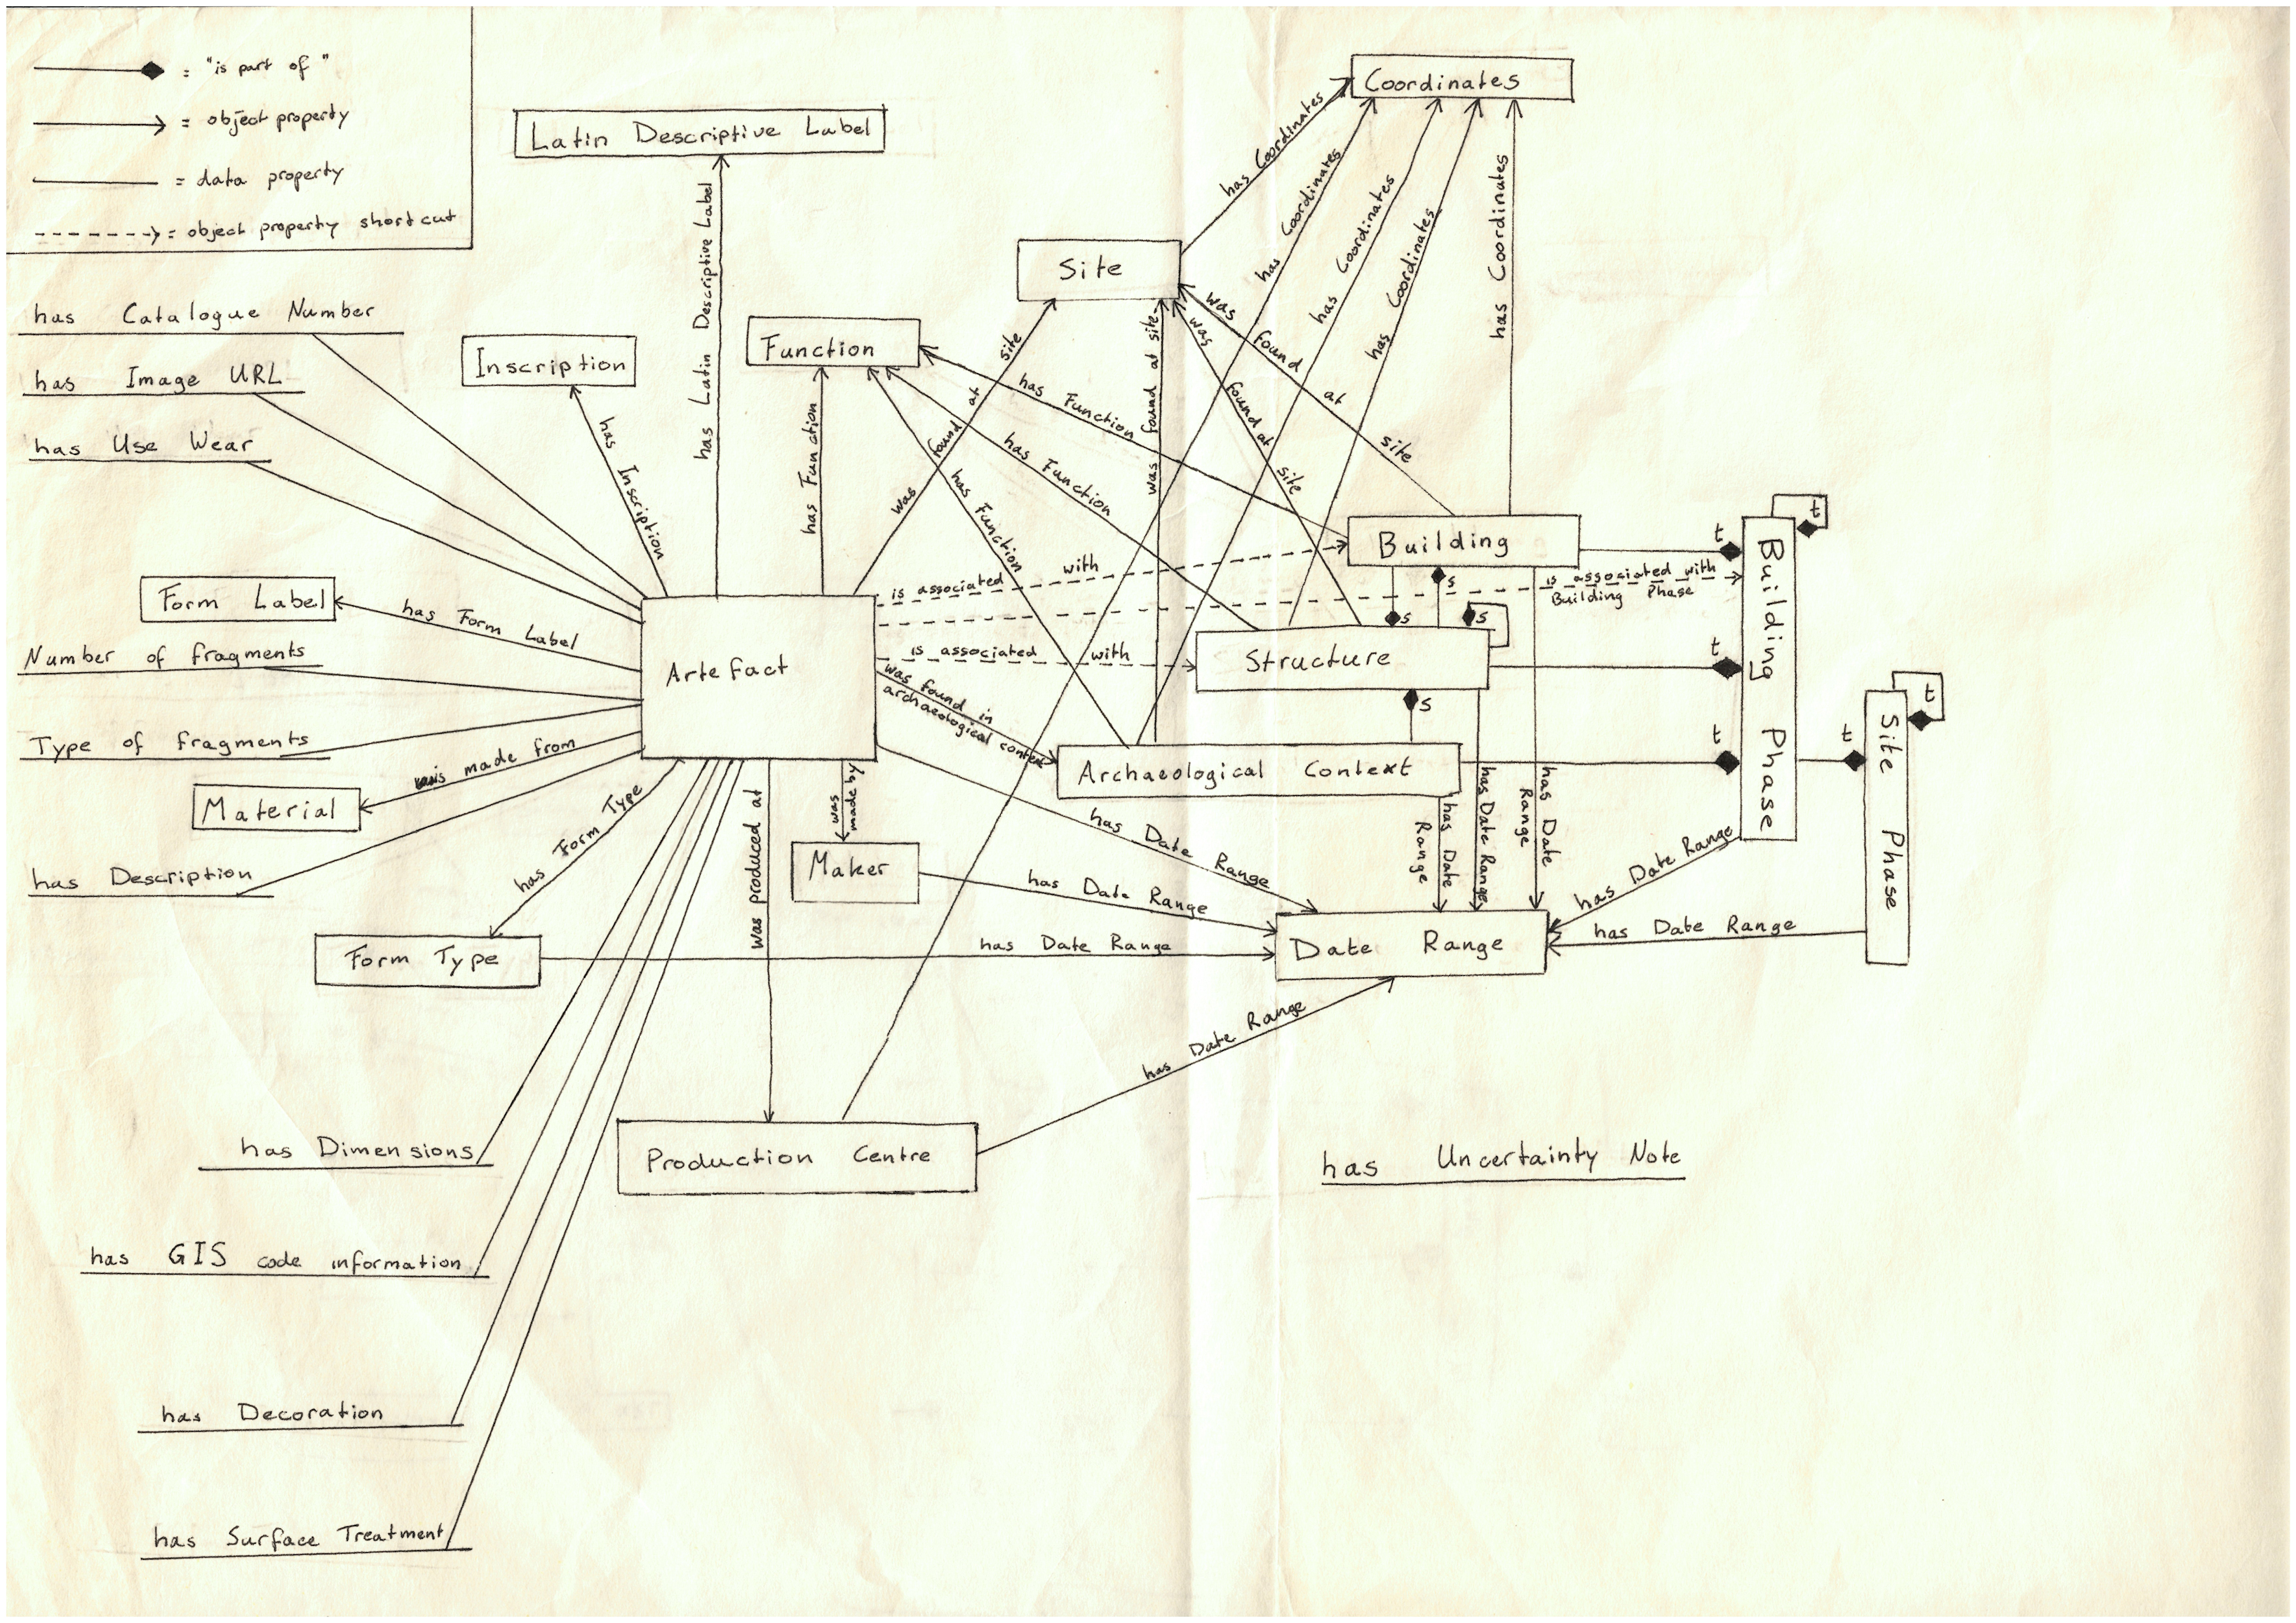
This ultimately resulted in the ontology structure. Figures 3-7 demonstrate two different views of the ontology model. Figure 3, Figure 6 and Figure 7 show the class model's hierarchical aspect, the vertical dimension, and Figure 4 and Figure 5 show the horizontal dimension. The model is thus three-dimensional. One way of visualising it is to take the image from Figure 5 and imagine the subclasses specified in Figure 3 'hanging under' their respective superclasses as extra layers.
The arrows between classes in Figure 5 are the properties that are used to link two classes in a triple statement. Note that while many properties have been defined uni-directionally, these often have a counterpart which is their inverse. So the property 'was_made_by', which links 'Artefact' to 'Maker', has an inverse property 'made' which links the same classes, but with their roles of subject and object reversed in triple statements. All classes and properties have been individually defined in the ontology (see Figure 8), it is therefore not necessary to detail each of these here. One specific aspect of Figure 5 worth mentioning, though, is the diamond-headed arrows. These arrows indicate so-called transitive properties and, in this case, they indicate that one class is part of another in a triple statement: i.e. 'Class_A, is_part_of, Class B'. This relation has been defined in two separate ways in the ontology: spatial, indicated with a black diamond-headed arrow, and temporal, indicated with an empty diamond-headed arrow. This allows, for example, for a 'Structure' to be spatially part of a 'Building' and temporally part of a 'Building_Phase'.
A more general problem is the ability of the data to answer the questions we want to ask. To be useful for inter-site analyses the data model needs to be able to incorporate data from recent, well-recorded, excavations as well as 'legacy data' from sites not excavated or published to this standard or with our types of questions in mind (see Allison 2008). To answer questions at a range of levels of detail we need to be able to meaningfully integrate in the model detailed data with more coarse-grained information. The ontology was largely modelled using the dataset compiled from the excavations of the fort at Ellingen as a case study. These excavations were carried out using spits, rather than stratigraphically, which means that important taphonomic, and especially stratigraphic, information is often lacking. This means that, to use this ontology for data from other sites, extra classes would be needed beyond those that would have resulted from using only the Ellingen data. Thus, 'Archaeological_Context' (i.e. using the single context recording method) is a class, but one that was not used comprehensively and systematically in these particular excavations. Relations have, therefore, been defined such that 'Archaeological_Contexts' can be part of 'Structures' which can be part of a number of ever larger 'Structures' and 'Buildings' and ultimately 'Complexes'.
For an ideal dataset, finds would have been recorded with precise contextual information (e.g. as a 3D geo-spatial reference), which could be part of structures (e.g. rooms, or clusters of postholes), which might together be interpreted as buildings. These could be further combined into larger 'Complexes' (e.g. the praetentura or front part of a military fort) at a higher stage of the hierarchy. A sensible way of relating these classes in an ontology could be in the form of the following triple statements:
1: Artefact, was_found_in, Archaeological_Context
2: Archaeological_Context, is_part_of (spatial), Structure
3: Structure, is_part_of (spatial), Building
4: Building, is_part_of (spatial), Complex
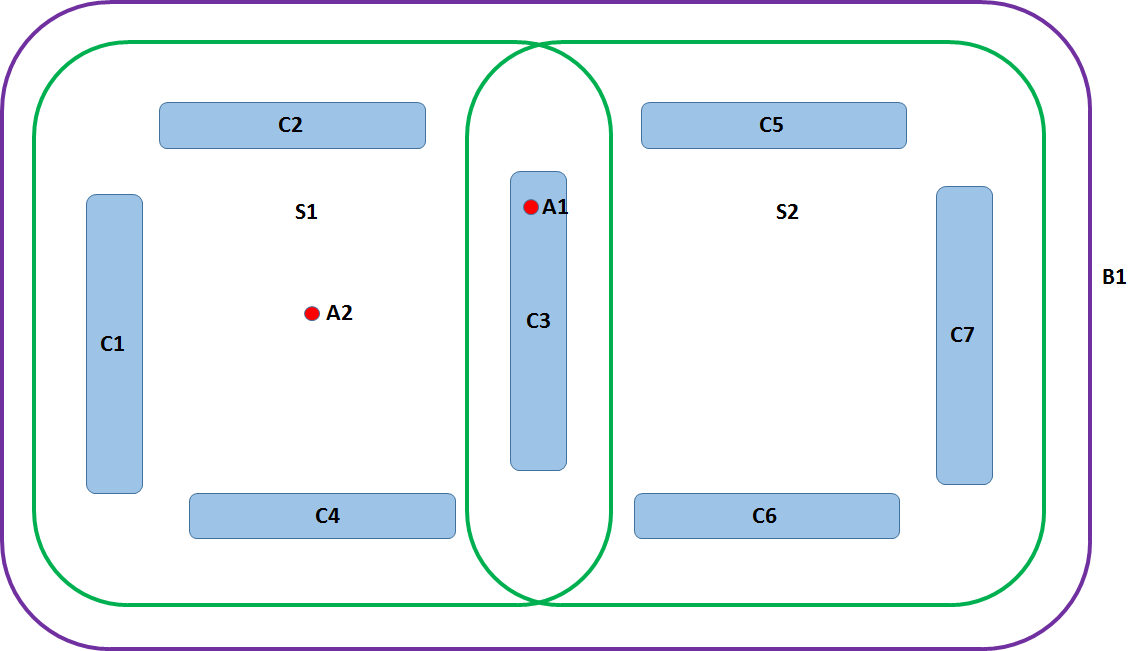
This makes for a neat hierarchical way of storing data and, consequently, for relatively straightforward querying, since the relation between artefacts, the archaeological contexts they were found in and the associated structures and buildings is clear. Reality, of course, is not always so neat, as illustrated in the hypothetical site in Figure 9, which allows us to consider some aspects of spatial analysis. In this hypothetical excavation seven archaeological contexts, C1-7 (e.g. foundation trenches for walls), were identified and two artefacts, A1 and A2, were found. The excavator has identified the whole as a building (B1) with two rooms (S1-2). Artefact A1 was recorded as having been found within context C3. However, artefact A2 was only provenanced to S1 but, for some reason that is no longer clear, not to a specific context within S1. How should this be modelled in the ontology (we have limited this example to the level of Building)? We want to retain the option for detailed data input and analysis, but at the same time we need to fit artefact A2 into the model somewhere, with as much contextual information as possible.
The solution here was to insert a shortcut property in the hierarchy (in Figure 5, the empty arrows represent the shortcut relations). Rather than an artefact being related to an archaeological context in the ontology, it can also be associated just with a structure or building, without the context being specified. The possibilities for triple statements now read:
1: Artefact, was_found_in, Archaeological_Context
2: Archaeological_Context, is_part_of (spatial), Structure
3: Structure, is_part_of (spatial), Building
Or
1: Artefact, is_associated_with, Structure
2: Structure, is_part_of (spatial), Building
Or
1: Artefact, is_associated_with, Building
This means that, formally, from the point of view of the ontology, the classes 'Archaeological_Context' and 'Structure' are a bit superfluous, as they are no longer necessary to link to the higher levels in the hierarchy (though for 'Structure', this is only the case when a building or complex is the highest class specified). However, they do allow for more detailed information storage and querying the higher quality data where available. The flexibility of the ontology allows changes such as these to be made even when data have already been entered.
In general, though, the quality of detailed provenance information for artefacts obviously impacts on the types of intra-site spatial analyses that can be carried out. In previous spatial analyses of artefact distribution, using standard RDBs and GIS, Allison and Sterry have compared findspots to interpret consumption practices at the military bases of Vetera I and at Ellingen (e.g. for ceramic remains: Allison 2005, 836-37; Allison and Sterry 2015). For many of the artefacts there is only basic provenance information (e.g. to a long trench) and no more precise contextual information in the excavation report. Allison and her team dealt with this problem by assigning arbitrary coordinates in the middle of a trench, or a building, to which they then provenanced the artefact (see Allison et al. 2005, section 7.2.2; Allison 2013, 421-22). Since ontologies, unlike some spatial analysis tools, are not flummoxed by non-specific coordinates, we can conceptually improve upon this. If we assign the coordinate range of the building or structure to the artefact, but also assign a compensatory uncertainty value to it, we can 'spread out' the artefact across the area. This means we do not have a specific hypothetical point for the artefact, but a probability surface, which is a more accurate reflection of the situation and allows more subtle, but not necessarily more specific, statistical analyses.
Similar to problems encountered in analysing 'legacy data', or combined 'legacy data' and more recently excavated data, is the problem of integrating into an ontology, which aims to facilitate the answering of consumption-orientated questions, data collated by ceramic specialists that tend to be production orientated. As with the inclusion of the class 'Archaeological_Context' discussed above, this means including classes in the model that are less immediately useful for answering questions on consumption, such as whether a particular vessel was produced at Rheinzabern or La Madeleine, as well as including additional classes that are usually not explicitly identified in finds reports, such as the class 'Function'. This does, however, mean that the ontology is useful for diverse datasets and their analyses, and for further analyses that might require both information on consumption and more specific production information. It can deal well with the hierarchical and inter-linked nature of data about Roman pottery typically collected by UK and other specialists as set out, for example, in the document 'A Standard for Pottery Studies in Archaeology' (see Colley and Evans this volume).
Once an ontology, such as described in the above section, has been set up, we can either manually input the data into the OWL ontology through Protégé Editor or convert these 'legacy datasets' (i.e. Microsoft Access, Excel Spreadsheets, etc.) automatically. With a spreadsheet and a target ontology, if column-to-property and row-to-instance mapping rules are well defined, the transformation process can be done automatically using a specific program (although some manual checks may be required). In our case, I used a Java program to convert the spreadsheet into our ontology (see Sahoo et al. 2009). We were able to configure the program with different mapping rules to transform other datasets.
To see the ontology we have developed with these 'legacy data', or to develop your own, you can use Protégé. Protégé is written in Java language so it works on Windows/OSX/Linux systems. Figure 8 includes the URL for downloading Protégé and the Ellingen ontology and instructions for its use.
To get a good sense of the usefulness of ontologies for analysing archaeological data, it is also important to understand the processes required for using them in such analyses. This section commences with a short description of the Visual Query Interface I have developed to give an indication of some of the possible analyses that can easily be carried out using the tools discussed in this article.
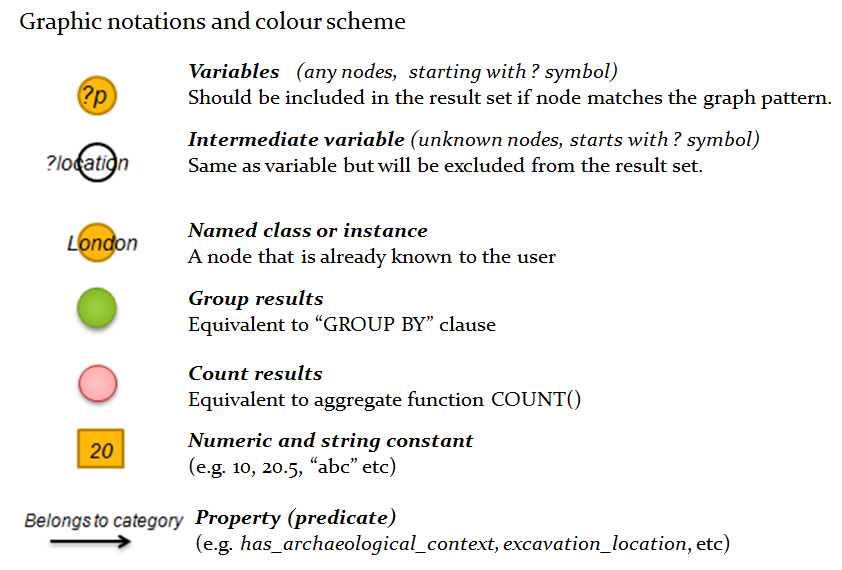
Ontological data can be searched using SPARQL, an SQL- like query language for querying RDFs. Native query languages such as SQL or SPARQL offer high flexibility and expressivity that are usually too complicated for non-IT professionals. A challenge is to consider the trade-off between ease of use and expressivity of the interface for searching because the two requirements usually contradict each other. We have to make sacrifices and compromise between them. A form-based advanced search uses a page consisting of text fields, combo-boxes and radio buttons to generate queries. However, this method is only capable of producing limited types of query (see Turbek 2008). To provide an intuitive search interface and to maximise its expressivity, we developed a graph-pattern-based search interface to help non-technical users write sophisticated queries without the use of overly complicated forms. Using the specifications outlined in Figure 10, the user can draw the graph pattern that matches the relations between the entities queried for. This pattern is translated into SPARQL by the program and the resulting query can be run through the ontology, with all the patterns that match the query drawing yielded as results.
In this section we discuss two sample analyses in which this query tool was applied to the tableware dataset from Ellingen. These analyses serve to demonstrate the usefulness of the ontology by giving an indication of some of the types of analyses that can easily be carried out using the ontology and Visual Query Interface discussed in this article. These two examples comprise: a) an analysis of the distribution of different vessel forms ('Form_Label') among the buildings within the fort at Ellingen; and b) an assessment of whether the relative quantities of the different forms changed over time.
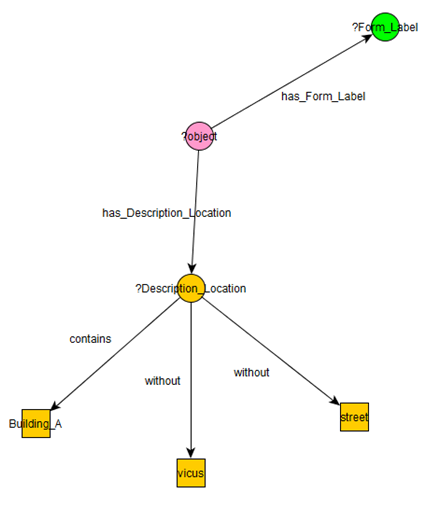
Figure 11 shows the query for a) as it is drawn in yEd, which is the graphs editing tool that uses visual notations for modelling data (see yWorks 2017). The drawn query counts all objects with a 'Form_Label' for which the 'Description_Location' contains the phrase 'Building_A' and does not contain 'vicus' or 'street' and groups them by 'Form_Label'. When we first ran this query we realised we had not adequately characterised the data that were put into the ontology from the descriptive fields in the spreadsheet. For example, buildings to the east of the fort at Ellingen, in an area identified by Zanier as a vicus, were labelled with some of the same letters as the buildings in the fort (i.e. Buildings A, B, and C – see Zanier 1992: e.g. 218, 326, 327). That is 'Vicus Building A', is different from 'Building A' in the fort proper. Furthermore, some of the provenances within the fort include 'Building A' in their description although they are not actually in this building – for example, 'street south of Building A' (Zanier 1992, 321, provenance 13 03 69). To exclude finds with these provenances from our analysis of finds from Building A, two clauses concerning 'vicus' and 'street' were inserted into the query. Here, rather than clean the data in the ontology and show the query without these elements, we opted to add in these two qualifying clauses to demonstrate the flexibility of the Query Interface.
The Query Interface yields the results in an Excel-compatible spreadsheet, which makes further processing and visualisation very easy. In this case, it generated a list of 'Form_Labels' and the associated number of artefacts with those 'Form_Labels' that were found in Building A. This means that, in a matter of seconds, the Query Interface condensed a list of all 1500 artefact records into a 2×10 table which lists the relevant form labels and the number of times this label occurs. The query was run for all buildings and the results transformed into pie charts (see Figure 12). Note that the 'Form_Labels' are in the original German. Given debates surrounding vessel form terminology and its translation, as discussed at both workshops for this network (see Section 2), we opted to keep the labels used in the excavation report.
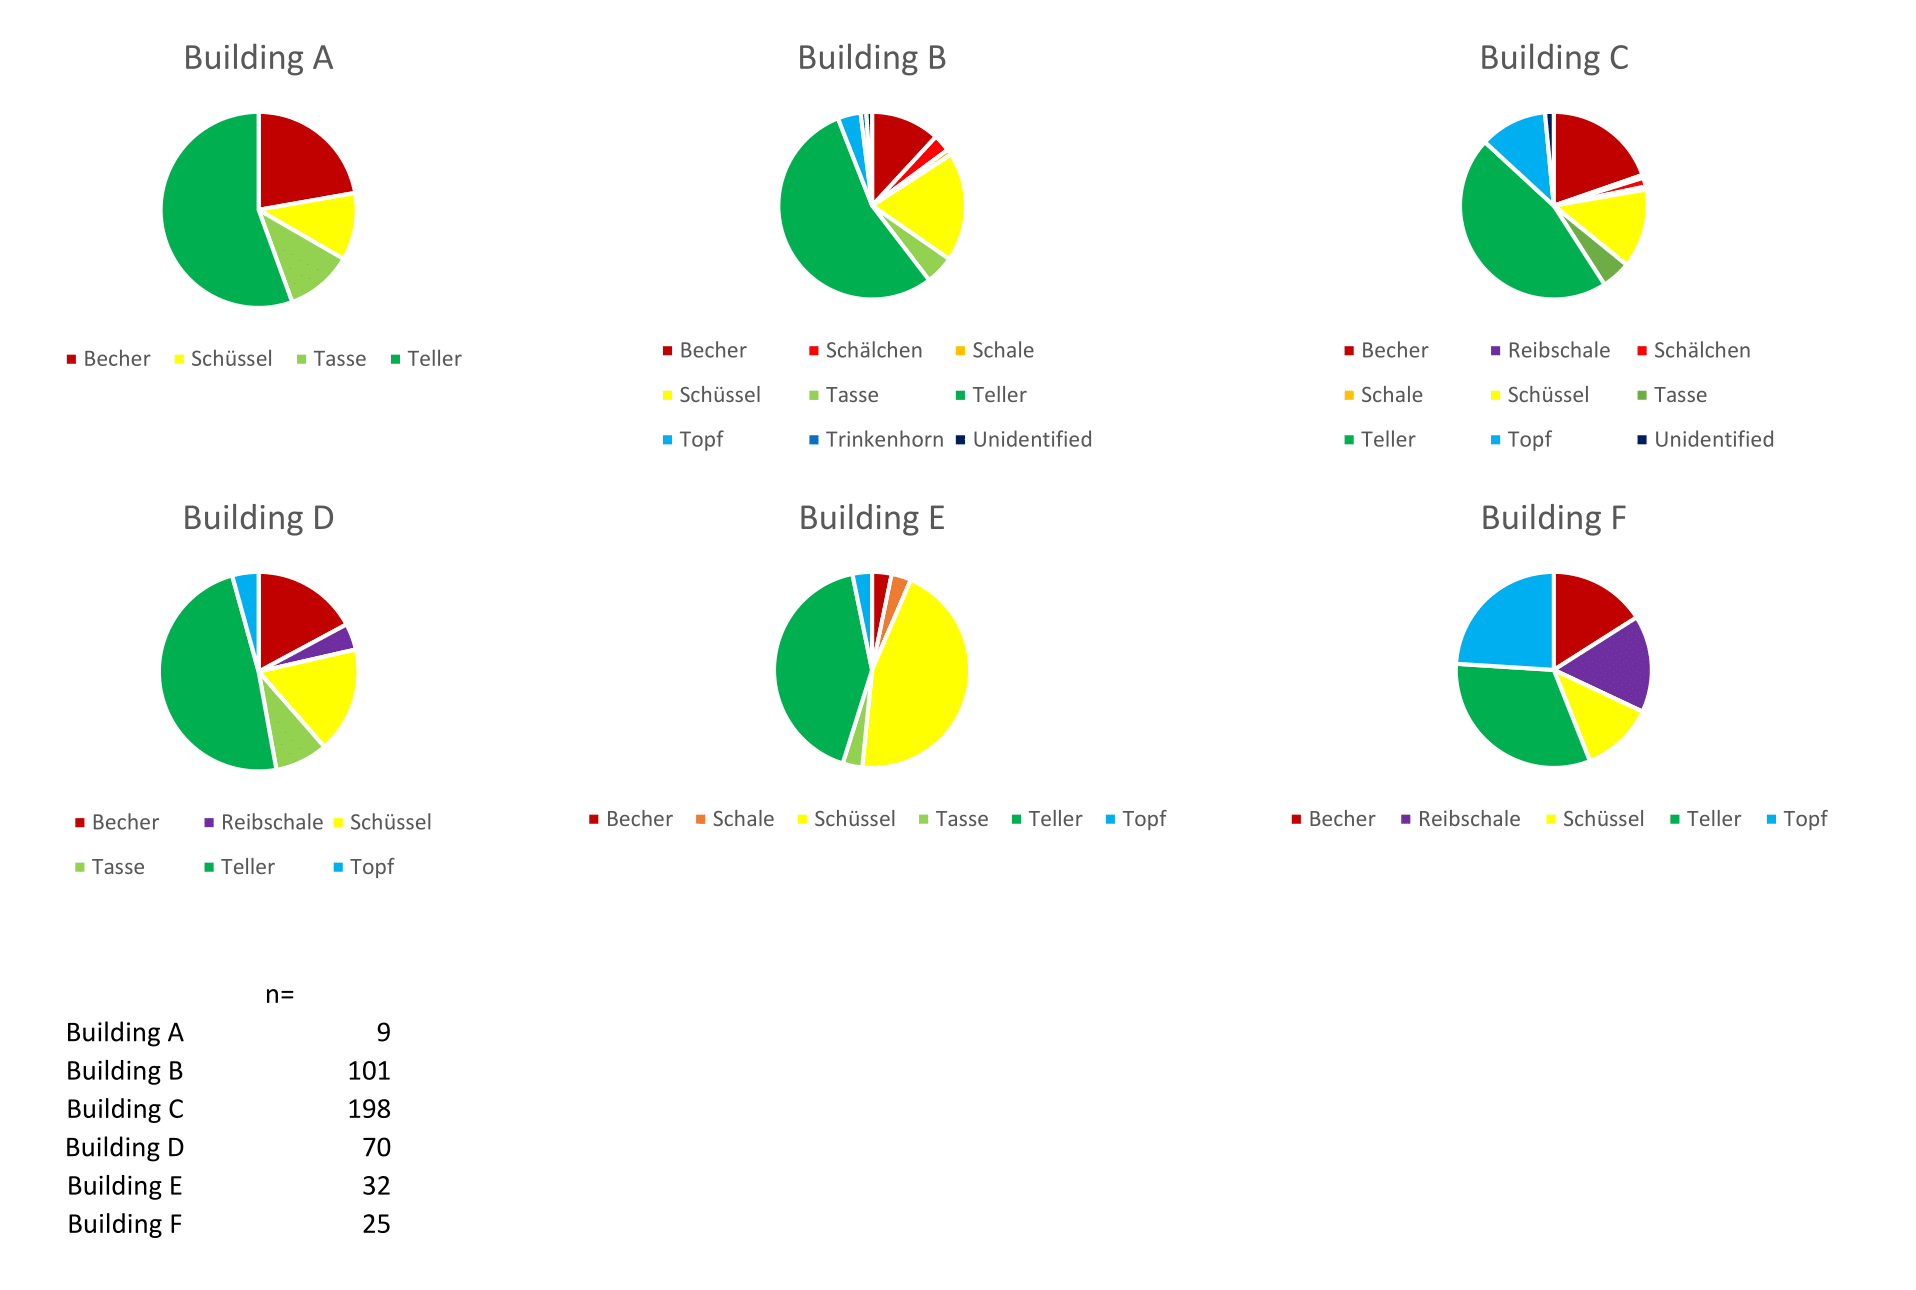
The pie charts demonstrate that there are relatively consistent proportions of vessel forms across the buildings in this fort. The majority of vessels in each of Buildings B, C, and D, the barracks buildings, are Tellers (i.e. plates), with smaller numbers of Bechers (i.e. cups or beakers) and Schüsseln (bowls or dishes). The pattern varies slightly for Buildings E and F, whose functions are less clear. Building E has more Schüsseln and Building F more equal proportions across all vessel types. While there seems to be a connection here between vessel form assemblages and building form and possibly building function (i.e. the assemblages in the barracks, Buildings B, C and D are the most similar), we should keep in mind the low numbers of vessels in these buildings, especially for Building A.
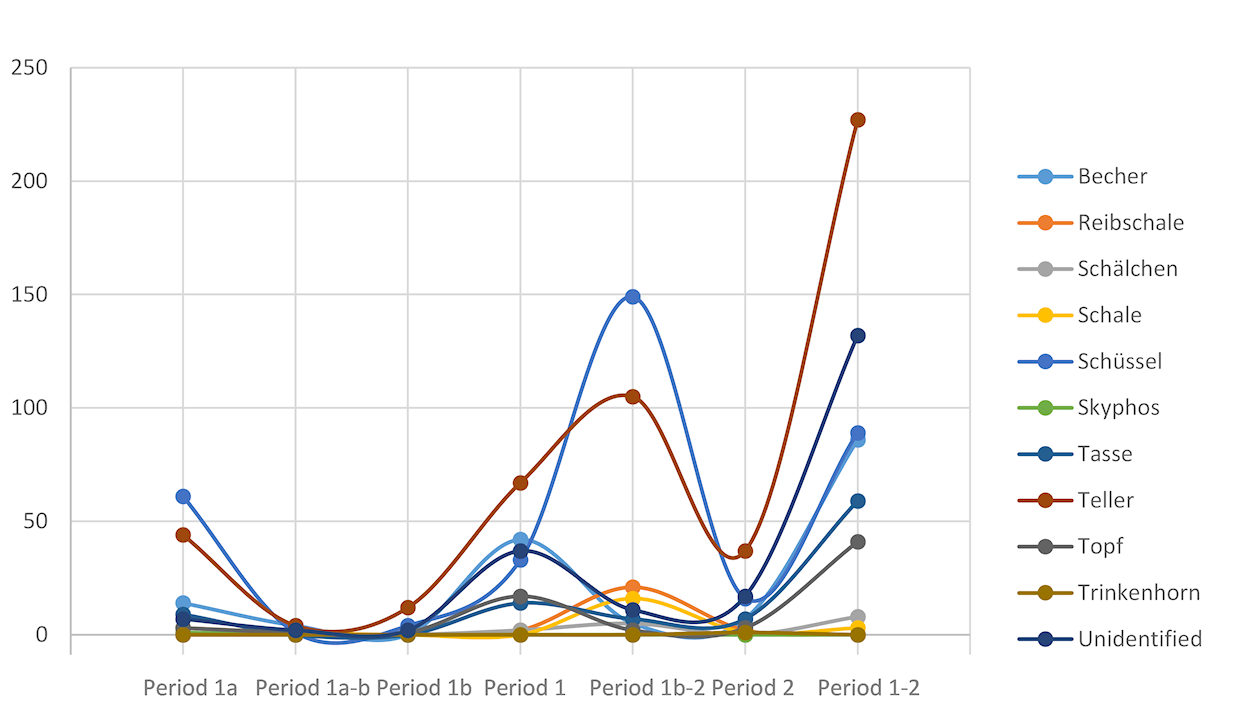
For the second analysis (b), we assessed whether the proportional use of these same 'Form_Labels' might have changed over time. We analysed the whole dataset across the entire site, rather than by building, as the sample sizes were too small for the latter. Figures 13-15 show the results of these analyses. Figure 13 shows the data across all periods, or building phases, as described in the original excavation report. Not all the artefacts have adequate chronological information to assign them to a specific building phase. So, for example, artefacts not clearly identified as being from Period 1a or Period 1b were assigned to Period 1, and others with an even less clear relationship to a particular period of the fort were assigned to Period 1-2.
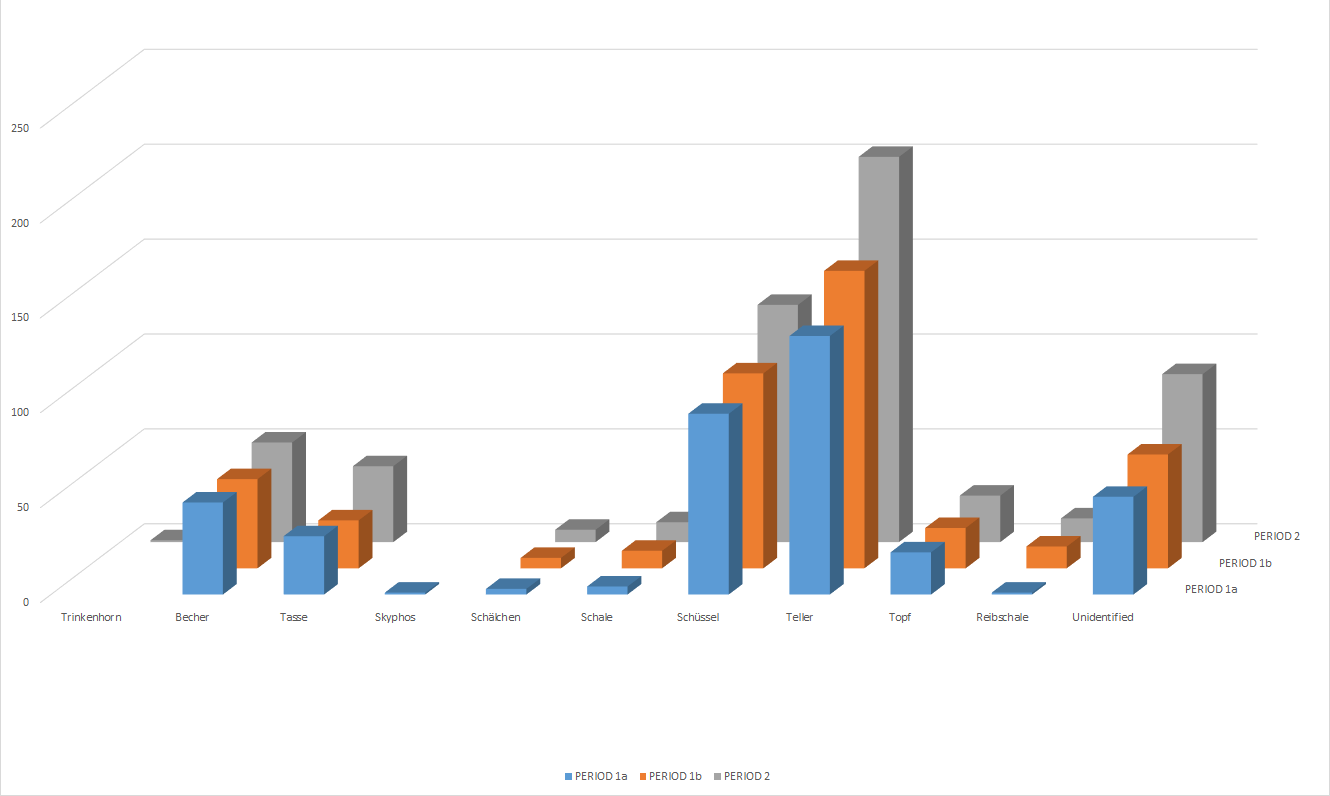
In Figure 14, the number of periods has been reduced to the main identified building phases, Periods 1a, 1b and 2. For this, we made an assumption that a sherd attributed to, for example, Period 1-2 has an equal probability of being from either period. Half the artefacts of a particular 'Form_Label' assigned to Period 1-2 were subsequently manually added to the same 'Form_Label' from the one period, and half to the other. Artefacts assigned to Period 1-2 were divided between Periods 1 and 2. Artefacts assigned to Period 1 were further subdivided between Periods 1a and 1b using the same method. The resulting analysis did not demonstrate any significant change over time among the use of various forms, although there was conceivably a general increase in most vessel forms that may result from the better preservation of data in the later period.
However, by dividing up the data from the less clearly defined periods we may be smoothing over any difference. Figure 15 shows a further analysis of only those data that were reliably assigned to the specific building phases Periods 1a, 1b, 2 (i.e. removing those with less secure attributions).
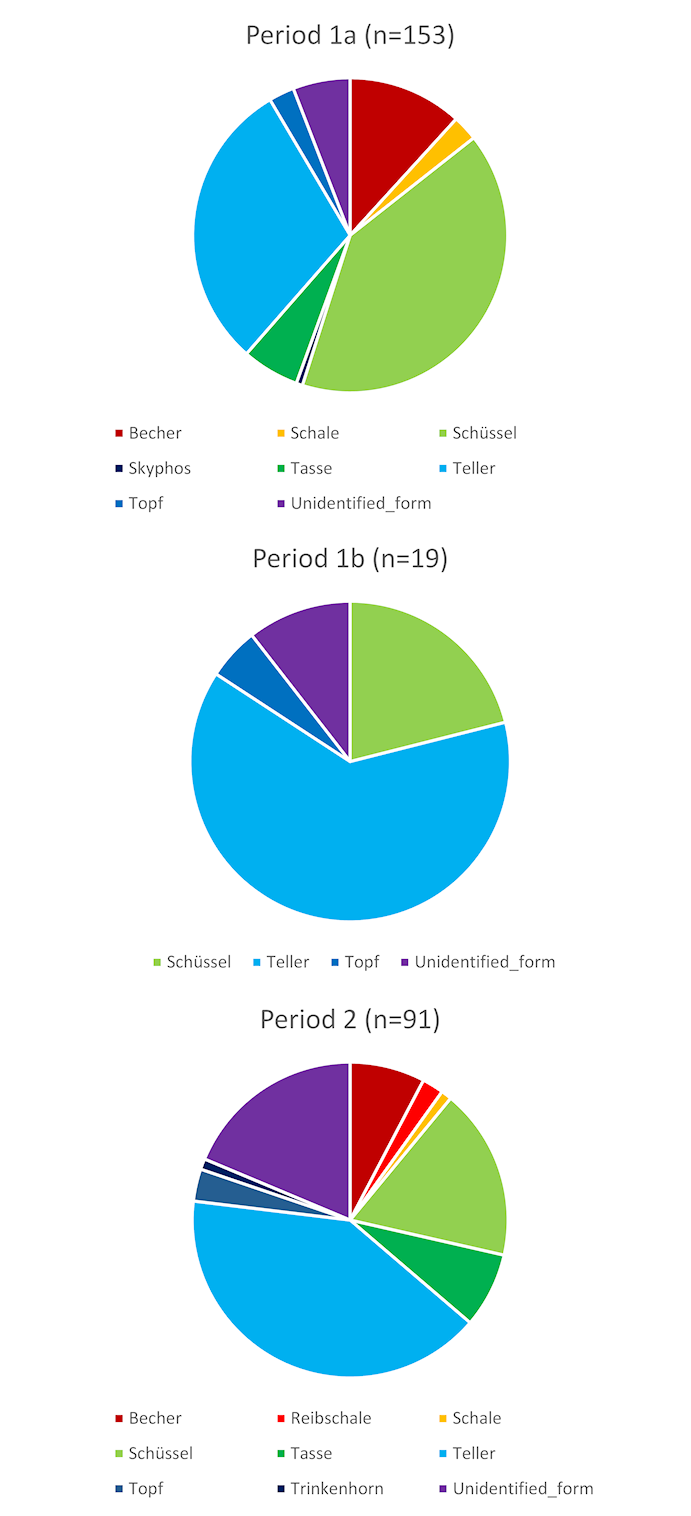
This analysis does seem to demonstrate a chronological change, at least between Periods 1a and 2. That is, nearly half (43%) of the forms from Period 1a are Schüsseln (bowls or dishes), while in Period 2 this is the case for Tellers (plates – 43%). It is tempting to see this pattern as a change in eating and drinking practices. The numbers of these forms from Period 1b are too small to be significant here. What is notable in all these analyses (Figures 12-15), though, is that, if the assumed functions of these vessels are correct, there are some two or three times more vessels associated with eating than with drinking in all phases of the fort's occupation.
These two sample analyses serve to demonstrate how an ontology for a single site, compiled from the 'legacy data' of its excavation report, can be used for intra-site spatial and chronological analyses of tablewares. That is, these analyses demonstrate that such data can be used for comparisons of food-consumption practices within different types of buildings in a single site (barracks, principia etc.). Such analyses have the potential to be extended to several sites simply and effectively using ontologies. In this latter regard these types of results have greater potential significance in assessing whether these food-consumption patterns are indicative of the practices within specific types of forts, units, buildings or social groups, have any regional specificity, or are part of empire-wide practices (see Mees this volume, especially Figure 8). With the relative ease with which extra data from other sites can be integrated into an ontology, comparing data patterns across sites on a scale necessary for investigating these types of questions in a more systematic fashion becomes a more realistic prospect.
The main focus of this article has been to construct an ontology that is suitable for collation of the types of data and for carrying out the types of analyses with which this network is concerned. The article demonstrates that an ontology is a useful collating tool for dealing with large amounts of data. The data can be compiled specifically in an ontology or, in this case and in many other circumstances in archaeology, imported into an ontology from databases already compiled in other formats to address other types of research questions or objectives. Importing data from other systems into an ontology is relatively straightforward. It does require some IT expertise, particularly with the use of Java language, but with well-mapped pathways between the fields and records of the RDB and the properties and instances of the ontology, this can be achieved in an efficient and timely fashion. The article also demonstrates how the types of analyses needed for a more consumption-orientated approach to Roman tablewares can be easily carried out on an intra-site basis, and potentially on an inter-site basis, whether or not the different databases initially have the same or similar structure.
When we set out to design this ontology for the objectives of this network, we had hoped to be able to include all the tablewares data from the four main sites used in the Engendering Roman Military Spaces project – the fortresses of Vetera I and Rottweil I-II and the fort at Oberstimm (Allison 2012; 2013), as well as the fort at Ellingen – in a single ontology. Our lack of expertise and knowledge in this area has meant that the processes and the decision making involved in developing this ontological model have taken more time than originally anticipated. That said, once we had successfully built this ontology and input the Ellingen data into this framework, it has been a less arduous task to carry out the above analyses. It will be an even less arduous task for other archaeologists to adapt this ontology, and to replace any of its potential taxonomic inaccuracies, for inputting comparable data from other sites for both data management and for carrying out inter-site analyses. This model (see Figure 8) can also be easily adapted to incorporate and integrate other types of archaeological data.
In other words, ontologies in general, and this model specifically, can be used to aggregate data from existing databases into a single model or into a number of easily linked models. As such, ontologies effectively provide a second life for datasets compiled for older projects and open up wider analytical options for Open Access databases (e.g. RGZM samian database - see Mees this volume). This does not necessarily require standardising terminology and can be used for large datasets, as is the concern for this network. Without too much effort, these datasets can be incorporated within an ontology model, and with more recently excavated datasets. Calculations and other types of analyses can then be carried out across different, and very large, datasets. This means that it becomes easier to look outside one's own projects for wider comparison. Ontological databases can lower the barriers to cooperation between archaeologists working in different (institutional or corporate) systems, since mutually incompatible systems can be relatively easily incorporated into a single ontology model.
Internet Archaeology is an open access journal based in the Department of Archaeology, University of York. Except where otherwise noted, content from this work may be used under the terms of the Creative Commons Attribution 3.0 (CC BY) Unported licence, which permits unrestricted use, distribution, and reproduction in any medium, provided that attribution to the author(s), the title of the work, the Internet Archaeology journal and the relevant URL/DOI are given.
Terms and Conditions | Legal Statements | Privacy Policy | Cookies Policy | Citing Internet Archaeology
Internet Archaeology content is preserved for the long term with the Archaeology Data Service (ROR). Help sustain and support open access publication by donating to our Open Access Archaeology Fund.